Fig. B.1
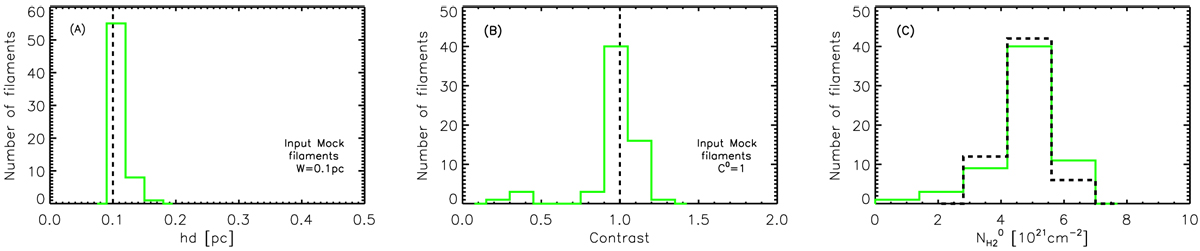
Histograms of derived crest-averaged properties (half-power diameter, hd, in panel a; filament contrast, C0, in panel b; background-subtracted central column density, ![]() , in panel c) in measurement tests using a population of Gaussian mock filaments. The vertical dashed lines in panels a and b indicate the fixed input properties of the mock filaments: FWHM width (W = 0.1 pc) and column density contrast (C0 = 1). In panel c, the black and green histograms show the distribution of input and derived background-subtracted column densities averaged along the filament crests, respectively.
, in panel c) in measurement tests using a population of Gaussian mock filaments. The vertical dashed lines in panels a and b indicate the fixed input properties of the mock filaments: FWHM width (W = 0.1 pc) and column density contrast (C0 = 1). In panel c, the black and green histograms show the distribution of input and derived background-subtracted column densities averaged along the filament crests, respectively.
Current usage metrics show cumulative count of Article Views (full-text article views including HTML views, PDF and ePub downloads, according to the available data) and Abstracts Views on Vision4Press platform.
Data correspond to usage on the plateform after 2015. The current usage metrics is available 48-96 hours after online publication and is updated daily on week days.
Initial download of the metrics may take a while.