Fig. A.3
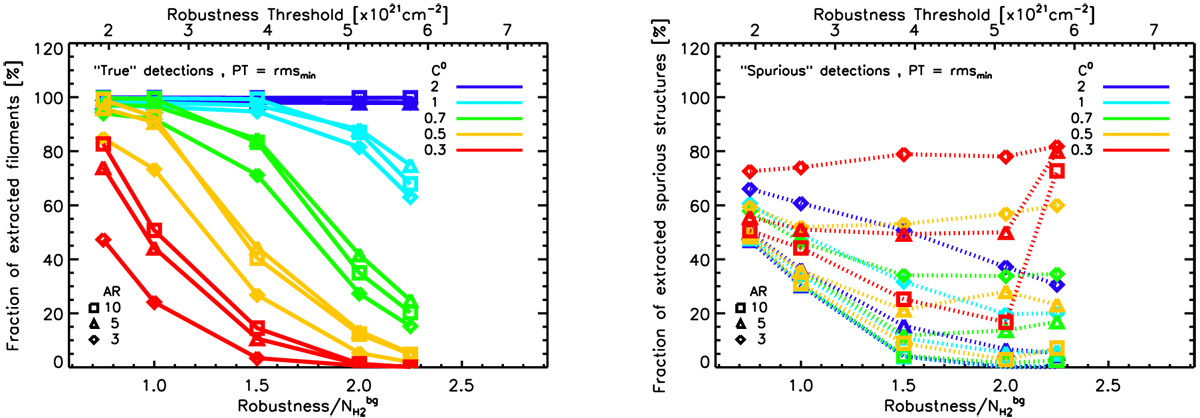
Left panel: fractions of “true” detections (solid color lines) in tests of filament extraction as a function of the robustness threshold RT used with DisPerSE (in units of ![]() on the bottom x-axis and 1021cm−2 on the top x-axis), for three values of the input (AR = 3, 5, 10 – see symbols at the bottom left of the plot) and four values of the input column density contrast (C0 = 0.3, 0.5, 0.7, 1, 2 – color coded as shown at the top right of the plot). The statistics shown in this plot are based on a total of 1000 synthetic filaments with Gaussian profiles of FWHM = 0.1 pc for each set of (AR, C0) input values, added to the background map shown in Fig. A.1a. The persistence threshold used in DisPerSE was fixed to PT = rmsmin. Right panel:as in left panel but for the fractions of “spurious” detections (dotted color lines).
on the bottom x-axis and 1021cm−2 on the top x-axis), for three values of the input (AR = 3, 5, 10 – see symbols at the bottom left of the plot) and four values of the input column density contrast (C0 = 0.3, 0.5, 0.7, 1, 2 – color coded as shown at the top right of the plot). The statistics shown in this plot are based on a total of 1000 synthetic filaments with Gaussian profiles of FWHM = 0.1 pc for each set of (AR, C0) input values, added to the background map shown in Fig. A.1a. The persistence threshold used in DisPerSE was fixed to PT = rmsmin. Right panel:as in left panel but for the fractions of “spurious” detections (dotted color lines).
Current usage metrics show cumulative count of Article Views (full-text article views including HTML views, PDF and ePub downloads, according to the available data) and Abstracts Views on Vision4Press platform.
Data correspond to usage on the plateform after 2015. The current usage metrics is available 48-96 hours after online publication and is updated daily on week days.
Initial download of the metrics may take a while.