Fig. A.2
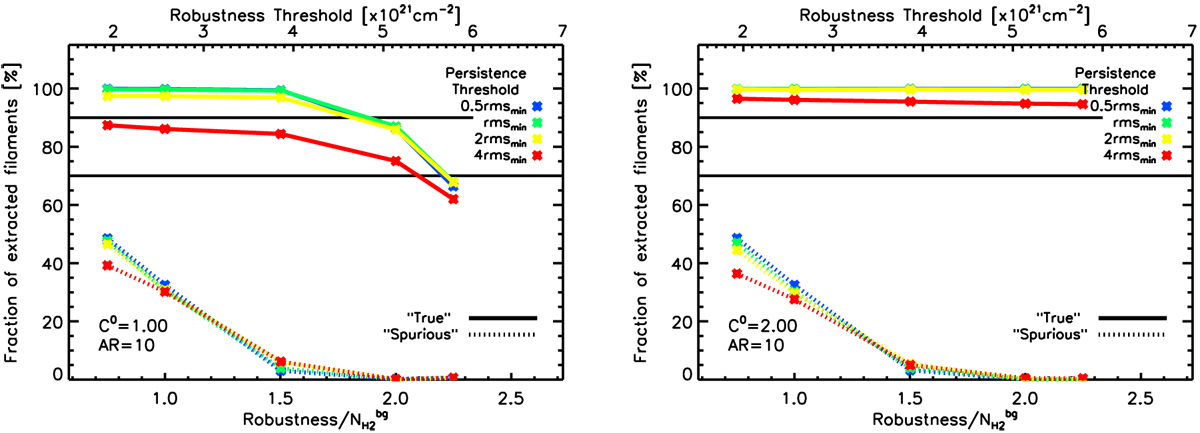
Left panel: fractions of “true” detections (solid color lines) and “spurious” detections (dotted color lines) in tests of filament extractions as a function of the robustness threshold RT used with DisPerSE (in units of ![]() on the bottom x-axis and 1021cm−2 on the top x-axis), for four values of the persistence threshold PT (0.5 rmsmin, rmsmin, 2 rmsmin, 4 rmsmin, color coded as shown at the top right of the plot). The synthetic filaments used in these tests all had Gaussian profiles with FWHM = 0.1 pc, an AR = 10, a column density contrast C0 = 1 over the background, and were distributed in the map shown in Fig. A.1a. The statistics shown in the plot are based on a total of 1000 such synthetic filaments for each set of the two DisPerSE parameters RT and PT. The two horizontal black lines indicate completeness levels of 70% and 90%, respectively. Right panel: as in left panel but for synthetic filaments with intrinsic column density contrast C0 = 2 over the background.
on the bottom x-axis and 1021cm−2 on the top x-axis), for four values of the persistence threshold PT (0.5 rmsmin, rmsmin, 2 rmsmin, 4 rmsmin, color coded as shown at the top right of the plot). The synthetic filaments used in these tests all had Gaussian profiles with FWHM = 0.1 pc, an AR = 10, a column density contrast C0 = 1 over the background, and were distributed in the map shown in Fig. A.1a. The statistics shown in the plot are based on a total of 1000 such synthetic filaments for each set of the two DisPerSE parameters RT and PT. The two horizontal black lines indicate completeness levels of 70% and 90%, respectively. Right panel: as in left panel but for synthetic filaments with intrinsic column density contrast C0 = 2 over the background.
Current usage metrics show cumulative count of Article Views (full-text article views including HTML views, PDF and ePub downloads, according to the available data) and Abstracts Views on Vision4Press platform.
Data correspond to usage on the plateform after 2015. The current usage metrics is available 48-96 hours after online publication and is updated daily on week days.
Initial download of the metrics may take a while.