Fig. A.1
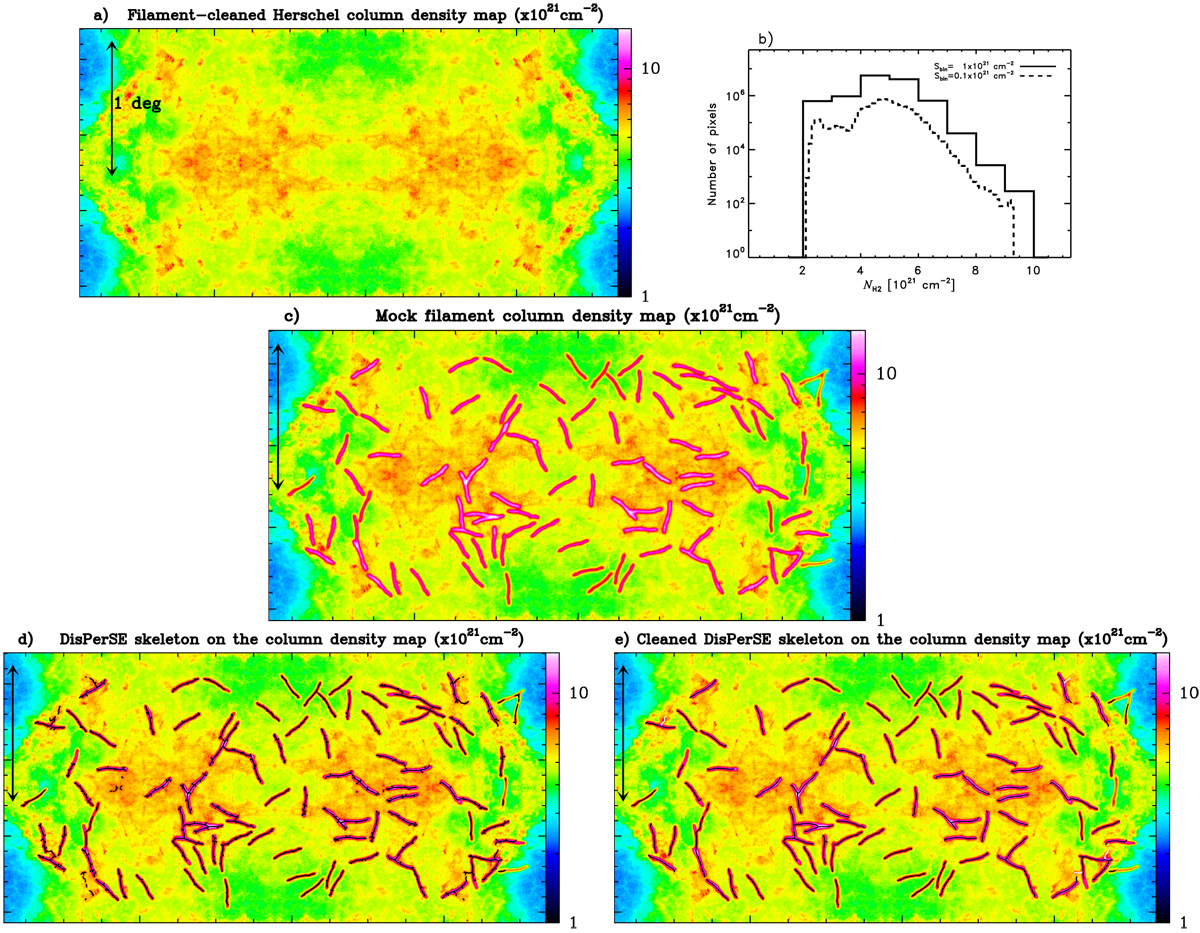
Panel a: “background” map used in our tests of filament extraction, corresponding to a 4° × 2° portion of a Herschel column density map after subtraction of compact sources and filamentary structures with the getsources and getfilaments algorithms (Men’shchikov et al. 2012; Men’shchikov 2013). The vertical double arrow indicates the1° scale of the map and is the same on all the maps of this figure. The spatial resolution of the maps is 0.023 pc, corresponding to 18′′ at a distance of 260 pc. Panel b: column density histograms of the “background map” in panel a using two different bin sizes, Sbin = 1021 cm−2 (solid histogram) and Sbin = 1020 cm−2 (dashed histogram). The minimum background column density, ![]() , and the minimum level of background fluctuations, rmsmin, used to adjust the DisPerSE parameters RT and PT (see text) were estimated from the median and standard deviation of column density values in the first bin of the solid histogram, respectively:
, and the minimum level of background fluctuations, rmsmin, used to adjust the DisPerSE parameters RT and PT (see text) were estimated from the median and standard deviation of column density values in the first bin of the solid histogram, respectively: ![]() cm−2 and rmsmin = 0.19 × 1021cm−2. Panel c: example of a synthetic column density map obtained by distributing 100 synthetic filaments with contrast C0 = 1 and AR = 10 over the “background map” of panel a. Here, all synthetic filaments were given a Gaussian profile with FWHM = 0.1 pc and a length of ~ 1 pc at the distance of 260 pc. Panel d: as in panel c but with the filament crests traced with DisPerSE overlaid in black. DisPerSE was run with a persistence threshold PT = rmsmin and a robustness threshold RT
cm−2 and rmsmin = 0.19 × 1021cm−2. Panel c: example of a synthetic column density map obtained by distributing 100 synthetic filaments with contrast C0 = 1 and AR = 10 over the “background map” of panel a. Here, all synthetic filaments were given a Gaussian profile with FWHM = 0.1 pc and a length of ~ 1 pc at the distance of 260 pc. Panel d: as in panel c but with the filament crests traced with DisPerSE overlaid in black. DisPerSE was run with a persistence threshold PT = rmsmin and a robustness threshold RT ![]() . Panel e: as in panel d but after removing filament segments shorter than ten times the HPBW beam, i.e., after “cleaning” the DisPerSE skeleton (cf. Sect. 2.3). The white crests indicate the structures identified as “spurious” (four in this case), while the black crests correspond to “true” filaments.
. Panel e: as in panel d but after removing filament segments shorter than ten times the HPBW beam, i.e., after “cleaning” the DisPerSE skeleton (cf. Sect. 2.3). The white crests indicate the structures identified as “spurious” (four in this case), while the black crests correspond to “true” filaments.
Current usage metrics show cumulative count of Article Views (full-text article views including HTML views, PDF and ePub downloads, according to the available data) and Abstracts Views on Vision4Press platform.
Data correspond to usage on the plateform after 2015. The current usage metrics is available 48-96 hours after online publication and is updated daily on week days.
Initial download of the metrics may take a while.