Fig. 13
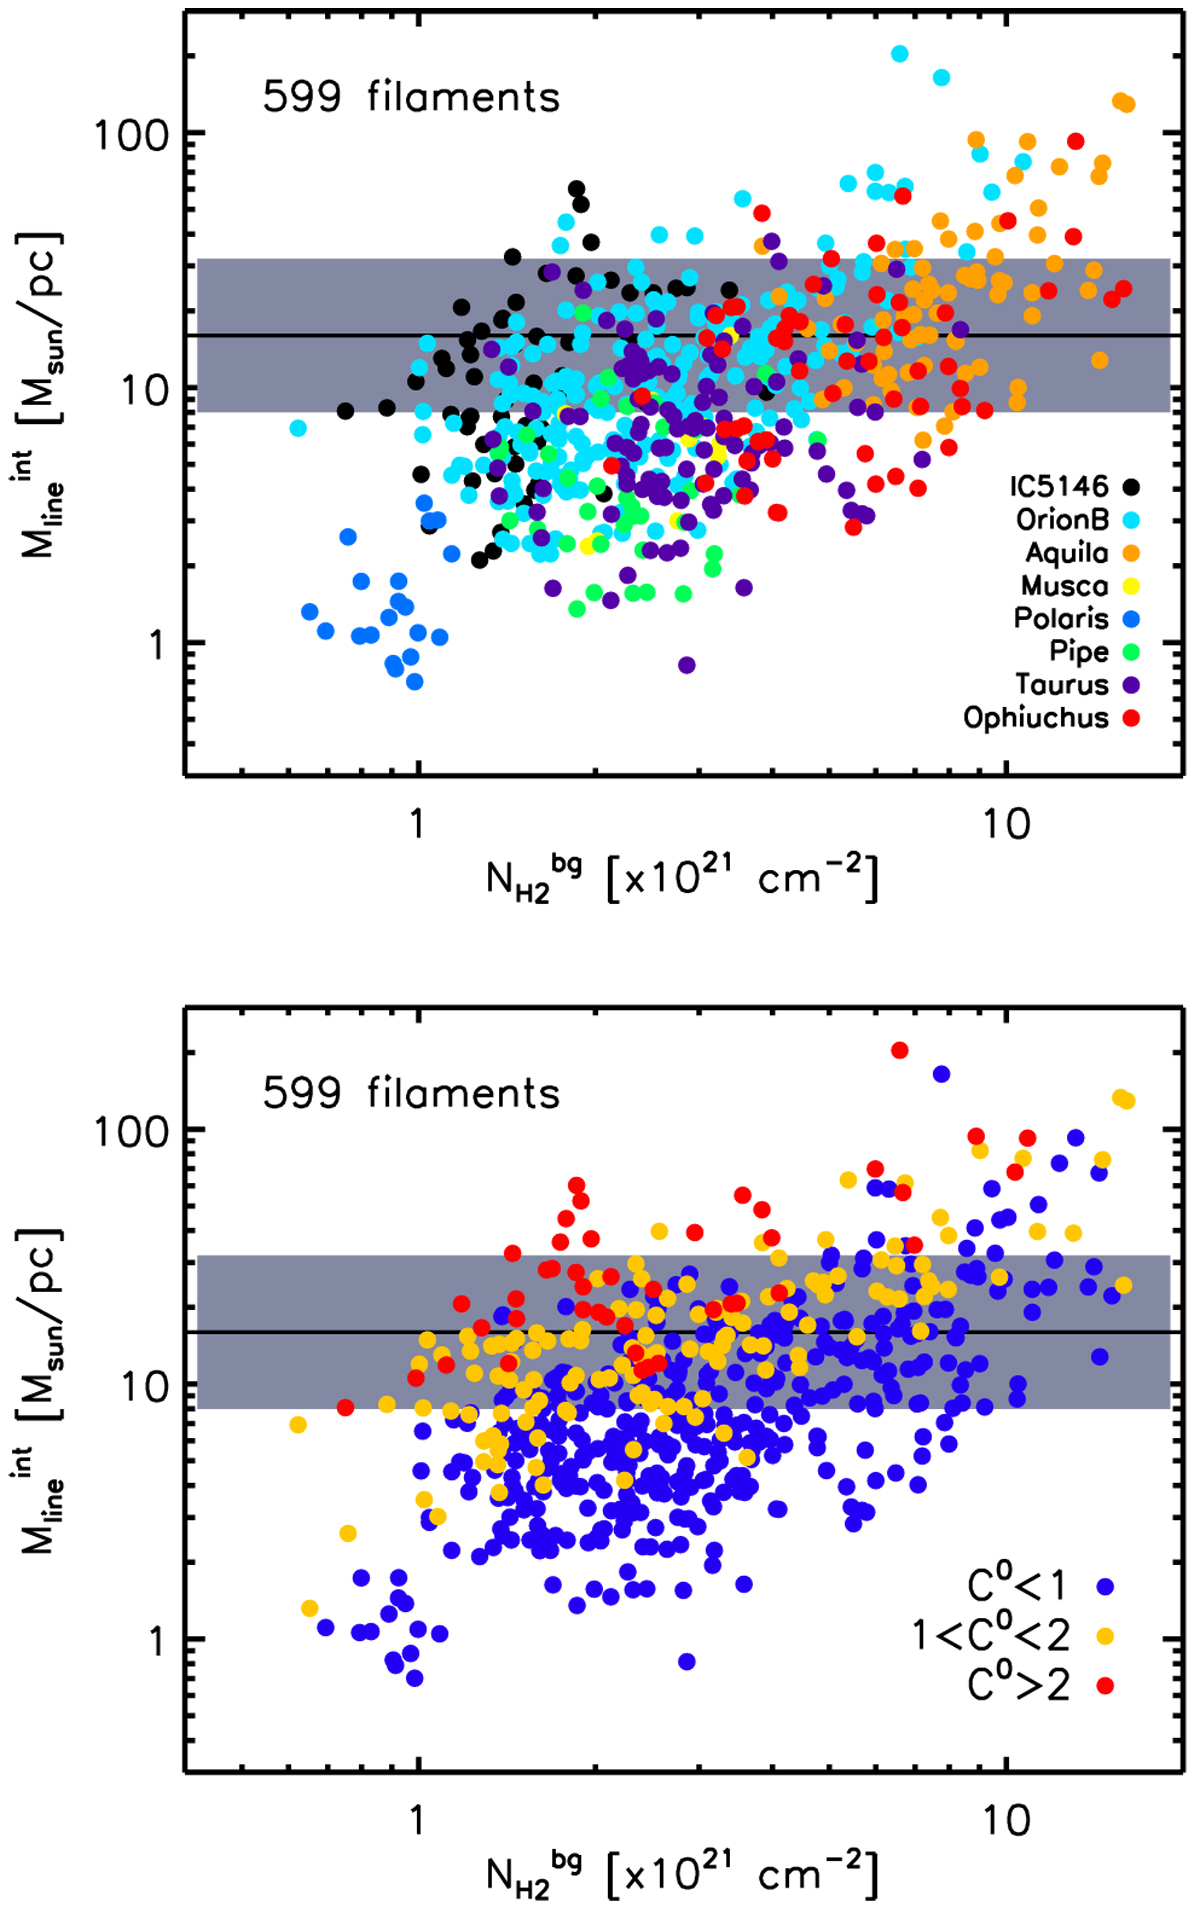
Top panel: mass per unit length ![]() against background column density
against background column density ![]() for the selected sample of 599 filaments. The horizontal black line corresponds to Mline = Mline,crit = 16 M⊙pc−1, and the grey area shows the transcritical filament regime with
for the selected sample of 599 filaments. The horizontal black line corresponds to Mline = Mline,crit = 16 M⊙pc−1, and the grey area shows the transcritical filament regime with ![]() (cf. Table 5 and Sect. 5). Bottom panel: same as the top panel, where each dot representing a filament is color coded here as a function of column density contrast C0 (the color code is shown on the bottom right). The percentages of filaments with C0 < 1, 1 < C0 < 2, and C0 > 2 are about 70%, 23%, and 7%, respectively, in the selected sample.
(cf. Table 5 and Sect. 5). Bottom panel: same as the top panel, where each dot representing a filament is color coded here as a function of column density contrast C0 (the color code is shown on the bottom right). The percentages of filaments with C0 < 1, 1 < C0 < 2, and C0 > 2 are about 70%, 23%, and 7%, respectively, in the selected sample.
Current usage metrics show cumulative count of Article Views (full-text article views including HTML views, PDF and ePub downloads, according to the available data) and Abstracts Views on Vision4Press platform.
Data correspond to usage on the plateform after 2015. The current usage metrics is available 48-96 hours after online publication and is updated daily on week days.
Initial download of the metrics may take a while.