Fig. 12
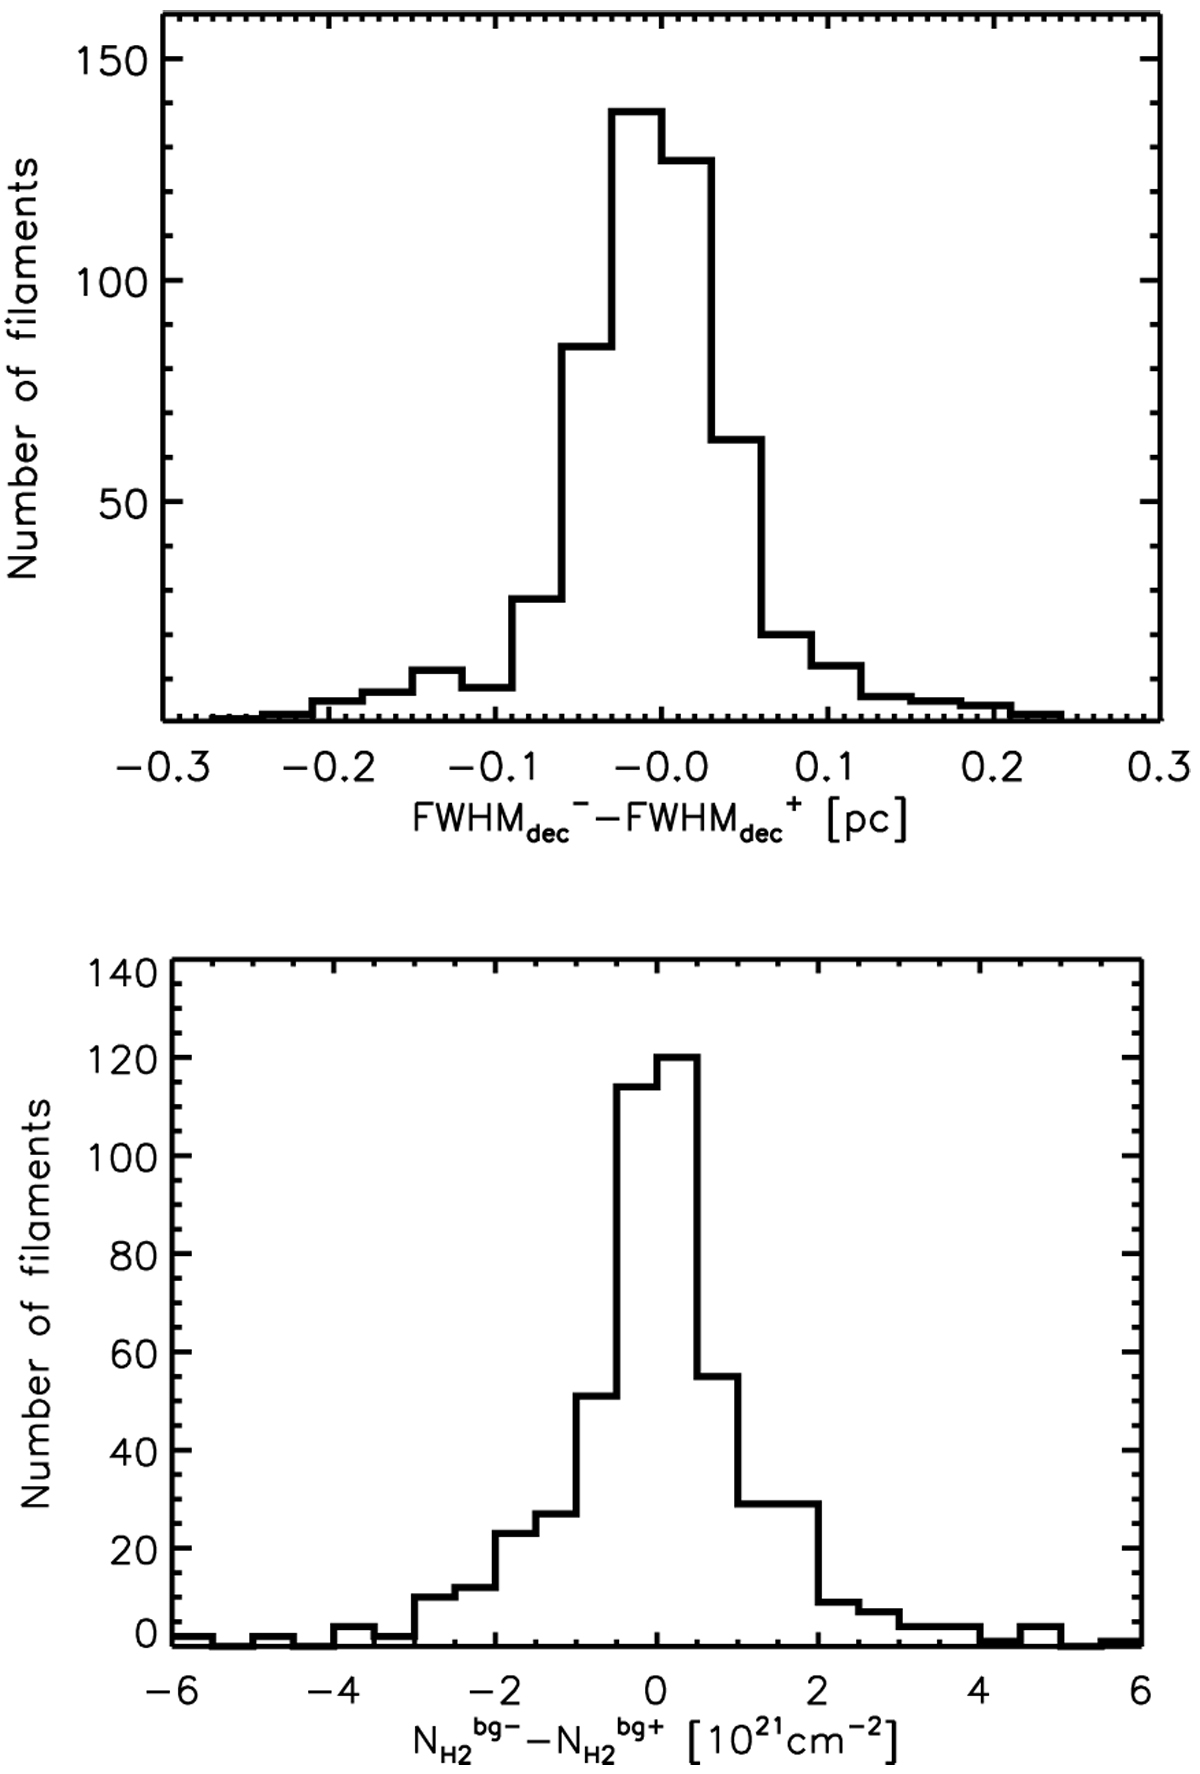
Distributions of the differences in median width (![]() , top panel) and median background column density (
, top panel) and median background column density (![]() , bottom panel), derived independently on either side of the 599 filament crests in the selected sample. These two distributionshave median ± equivalent standard deviation values of (0.003 ± 0.043) pc and (0.04 ± 0.93) × 1021 cm−2, respectively.
, bottom panel), derived independently on either side of the 599 filament crests in the selected sample. These two distributionshave median ± equivalent standard deviation values of (0.003 ± 0.043) pc and (0.04 ± 0.93) × 1021 cm−2, respectively.
Current usage metrics show cumulative count of Article Views (full-text article views including HTML views, PDF and ePub downloads, according to the available data) and Abstracts Views on Vision4Press platform.
Data correspond to usage on the plateform after 2015. The current usage metrics is available 48-96 hours after online publication and is updated daily on week days.
Initial download of the metrics may take a while.