Fig. 11
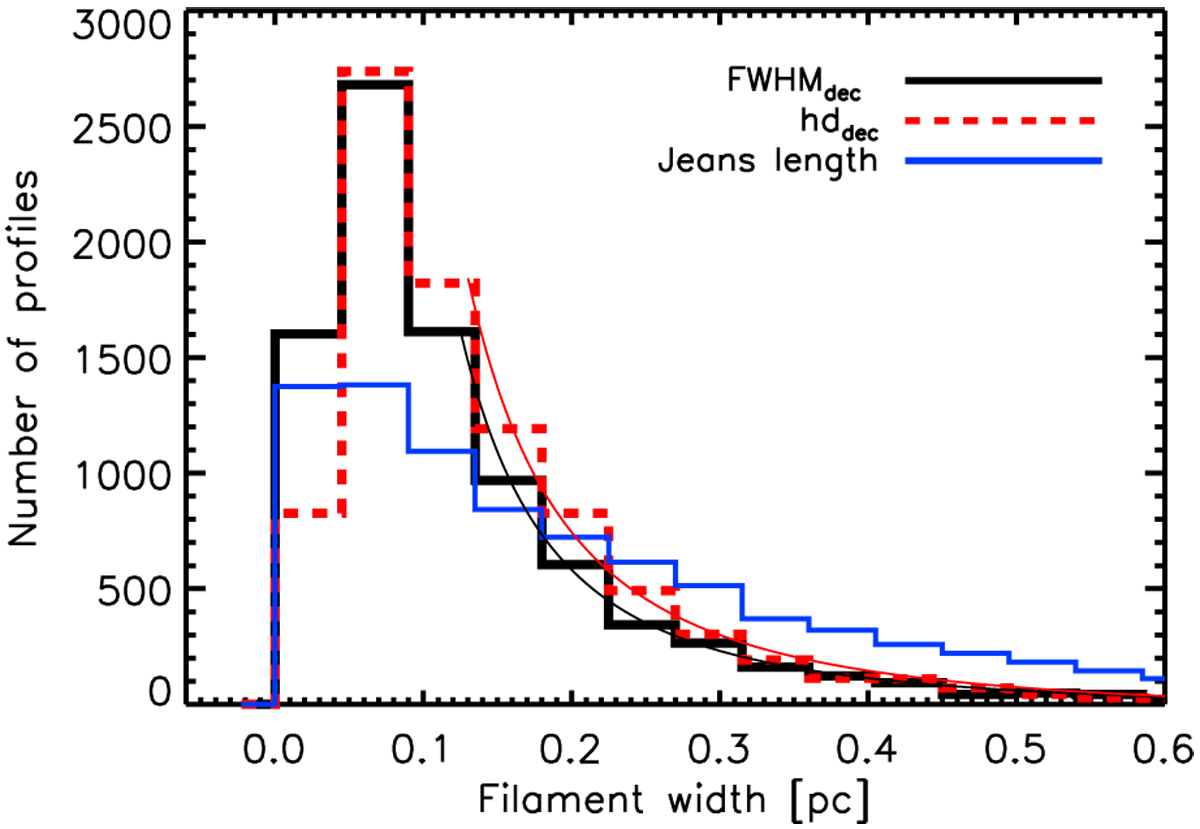
Distributions of ![]() (black) and
(black) and ![]() (red) widthsderived from individual profiles along and on either side of the crests for the selected sample of 599 filaments. The median
(red) widthsderived from individual profiles along and on either side of the crests for the selected sample of 599 filaments. The median ![]() and
and ![]() values are 0.09 and 0.11 pc, respectively, and the interquartile range is 0.11 pc for both distributions. The black and red curves show power-law fits to the tails of the
values are 0.09 and 0.11 pc, respectively, and the interquartile range is 0.11 pc for both distributions. The black and red curves show power-law fits to the tails of the
![]() and
and ![]() distributions, respectively (ΔN∕ΔW ∝ W−2.6±0.5, for both distributions). For comparison, the distribution of Jeans lengths,
distributions, respectively (ΔN∕ΔW ∝ W−2.6±0.5, for both distributions). For comparison, the distribution of Jeans lengths,
![]() , is also shown (blue histogram, cf. Fig. 7).
, is also shown (blue histogram, cf. Fig. 7).
Current usage metrics show cumulative count of Article Views (full-text article views including HTML views, PDF and ePub downloads, according to the available data) and Abstracts Views on Vision4Press platform.
Data correspond to usage on the plateform after 2015. The current usage metrics is available 48-96 hours after online publication and is updated daily on week days.
Initial download of the metrics may take a while.