Fig. 10
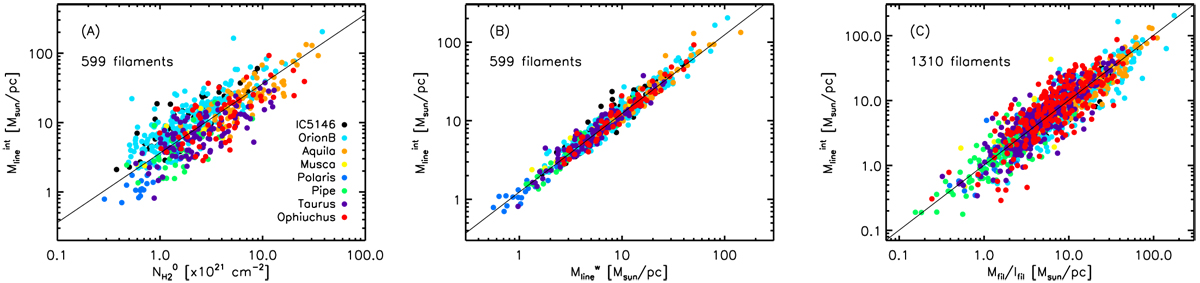
Panel A: mass per unit length integrated over the radial column density profiles, ![]() , against median central column density,
, against median central column density, ![]() , for the 599 filaments of the selected sample. The solid straight line shows the one-parameter best-fit linear relation
, for the 599 filaments of the selected sample. The solid straight line shows the one-parameter best-fit linear relation ![]() , where
, where ![]() is the centralgas surface density. Panel B: plot of
is the centralgas surface density. Panel B: plot of ![]() against
against ![]() for the same sample of filaments. The one-parameter best-fit linear relation is
for the same sample of filaments. The one-parameter best-fit linear relation is ![]() . Panel C: mass per unit length estimated as Mfil∕lfil (where Mfil is calculated summing the column density over the pixels within the area between the filament crest and Rout, after subtraction of
. Panel C: mass per unit length estimated as Mfil∕lfil (where Mfil is calculated summing the column density over the pixels within the area between the filament crest and Rout, after subtraction of ![]() , see text of Sect. 3.4) against
, see text of Sect. 3.4) against ![]() for the 1310 filaments of the “total” sample. The solid straight line shows the one-parameter best-fit linear relation
for the 1310 filaments of the “total” sample. The solid straight line shows the one-parameter best-fit linear relation ![]() .
.
Current usage metrics show cumulative count of Article Views (full-text article views including HTML views, PDF and ePub downloads, according to the available data) and Abstracts Views on Vision4Press platform.
Data correspond to usage on the plateform after 2015. The current usage metrics is available 48-96 hours after online publication and is updated daily on week days.
Initial download of the metrics may take a while.