Fig. 1
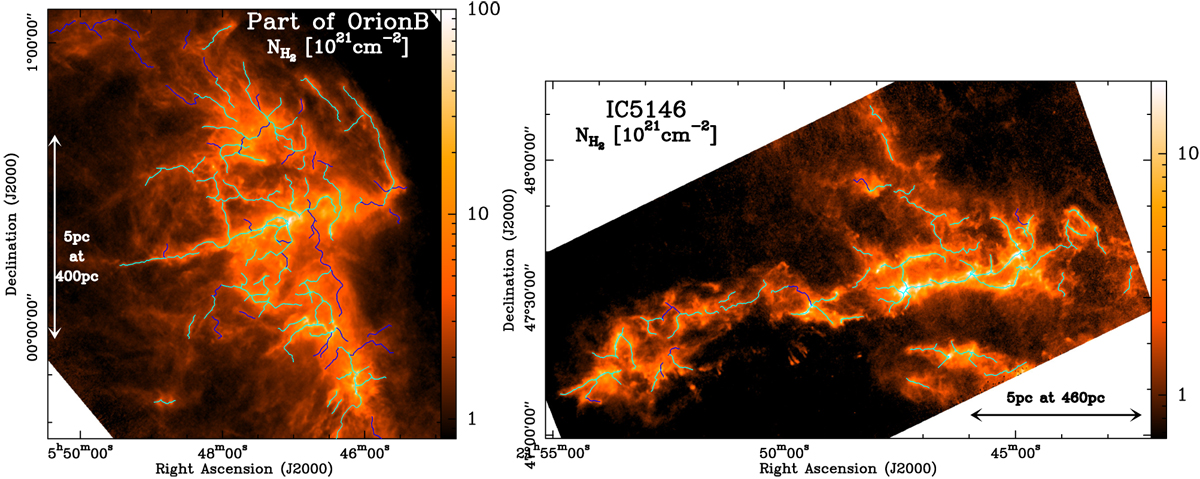
Herschel column density maps of a portion of the analyzed region in Orion B (left panel) and of the entire field analyzed here in IC5146 (right panel), as derived from HGBS data (http://gouldbelt-herschel.cea.fr/archives; cf. André et al. 2010; Arzoumanian et al. 2011; Könyves et al. in prep.). The effective HPBW resolution of these maps is 18.′′ 2. The crests of the filamentary structures traced in the two clouds using DisPerSE as explained in Sect. 2.2 are overlaid as solid curves. The cyan blue curves trace the filament crests of the selected sample, and the dark blue curves trace the crests of additional filaments from the extended sample (cf. Sect. 3.5 and Table 2). The maps of the other fields analyzed in this paper are shown in Appendix C.
Current usage metrics show cumulative count of Article Views (full-text article views including HTML views, PDF and ePub downloads, according to the available data) and Abstracts Views on Vision4Press platform.
Data correspond to usage on the plateform after 2015. The current usage metrics is available 48-96 hours after online publication and is updated daily on week days.
Initial download of the metrics may take a while.