Open Access
Fig. A.74.
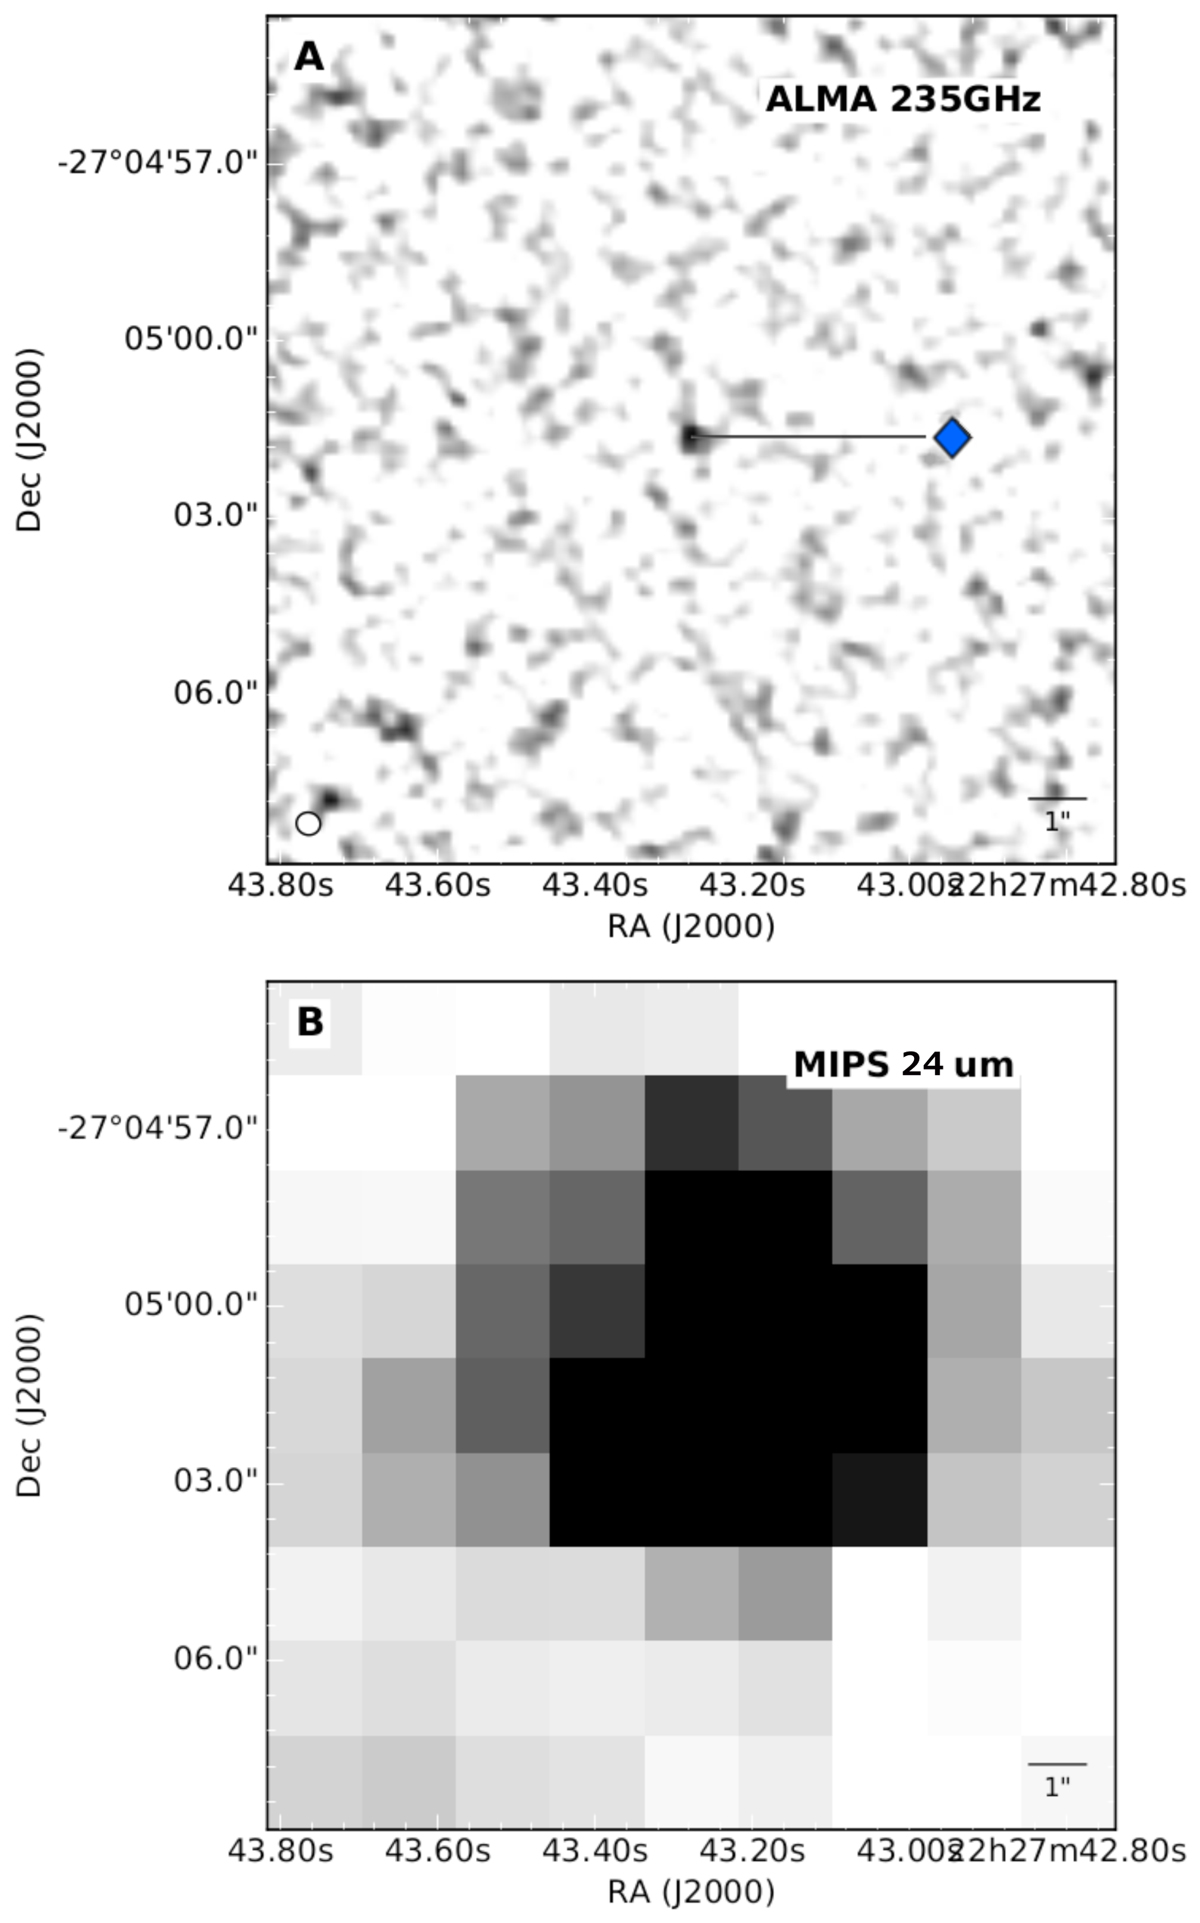
Panel A: continuum map of ALMA band 6. The blue marker indicates the ALMA dectection and corresponds to same data point in Fig. A.73. VLA maps not accessible, but the source is unresolved, as shown in Pentericci et al. (2000). Panel B: MIPS 24 μm continuum map.
Current usage metrics show cumulative count of Article Views (full-text article views including HTML views, PDF and ePub downloads, according to the available data) and Abstracts Views on Vision4Press platform.
Data correspond to usage on the plateform after 2015. The current usage metrics is available 48-96 hours after online publication and is updated daily on week days.
Initial download of the metrics may take a while.