Fig. 7.
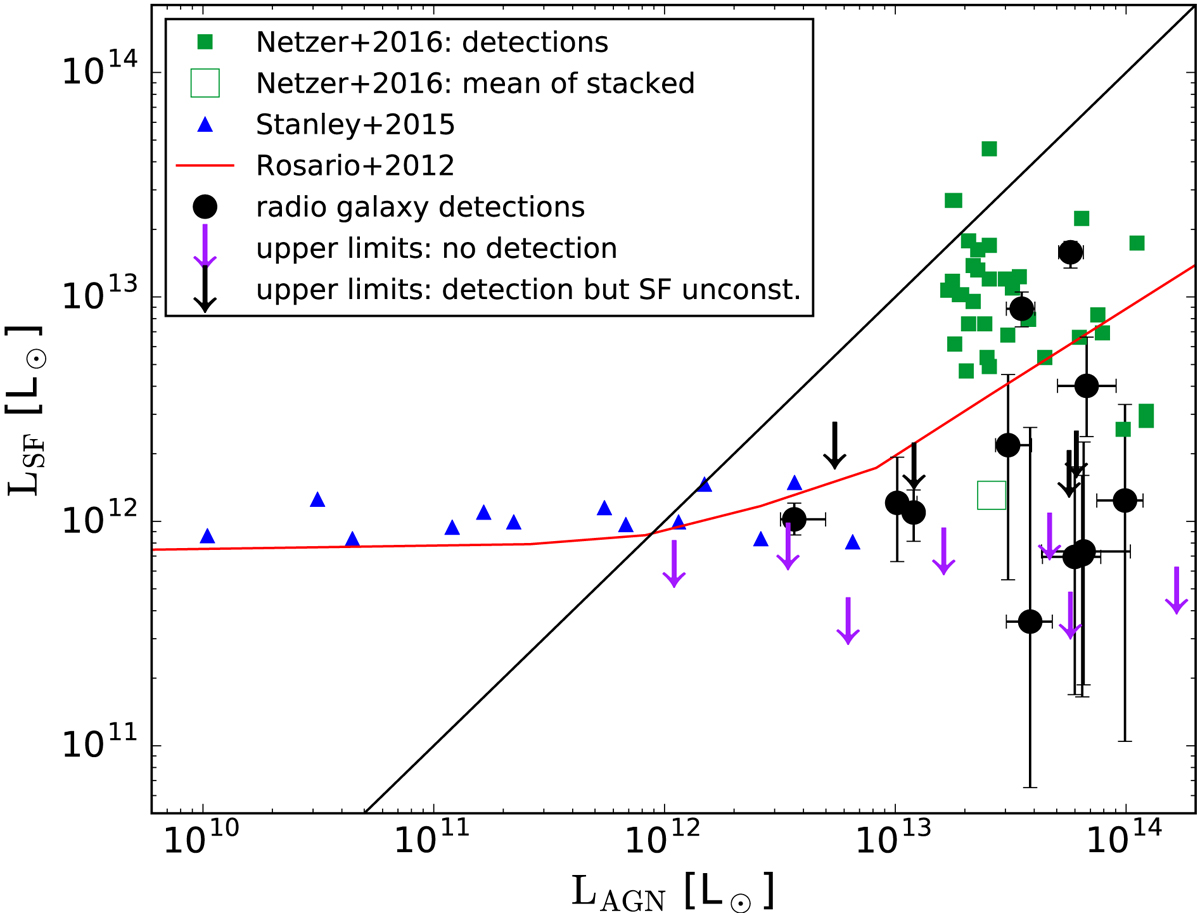
Comparison of our results in the LSF − LAGN plane to other studies. ![]() for our sample is scaled by a factor six to estimate the bolometric luminosity. Black circles indicate sources detected with ALMA. Black downward pointing arrows indicate sources detected in ALMA where the sub-mm flux is consistent with being dominated by synchrotron emission. Purple downward pointing arrows indicate sources not detected with ALMA. The X-ray selected sources from Netzer et al. (2016) detected with Herschel over the redshift range z = 2 − 3.5 are indicated with green squares; the large open green square is the SFR of the undetected sources which were stacked to estimate their median SFR. Blue triangles indicate X-ray selected sources from Stanley et al. (2015) over the redshift range, 1.8 < z < 2.1. The red line is the fit from Rosario et al. (2012) to the mean relation for AGNs over the redshift range 1.5 < z < 2.5 scaled up by a factor of two (see Netzer et al. 2016, for details). We indicate when the luminosity due to star formation equals that of the AGN with a black solid line.
for our sample is scaled by a factor six to estimate the bolometric luminosity. Black circles indicate sources detected with ALMA. Black downward pointing arrows indicate sources detected in ALMA where the sub-mm flux is consistent with being dominated by synchrotron emission. Purple downward pointing arrows indicate sources not detected with ALMA. The X-ray selected sources from Netzer et al. (2016) detected with Herschel over the redshift range z = 2 − 3.5 are indicated with green squares; the large open green square is the SFR of the undetected sources which were stacked to estimate their median SFR. Blue triangles indicate X-ray selected sources from Stanley et al. (2015) over the redshift range, 1.8 < z < 2.1. The red line is the fit from Rosario et al. (2012) to the mean relation for AGNs over the redshift range 1.5 < z < 2.5 scaled up by a factor of two (see Netzer et al. 2016, for details). We indicate when the luminosity due to star formation equals that of the AGN with a black solid line.
Current usage metrics show cumulative count of Article Views (full-text article views including HTML views, PDF and ePub downloads, according to the available data) and Abstracts Views on Vision4Press platform.
Data correspond to usage on the plateform after 2015. The current usage metrics is available 48-96 hours after online publication and is updated daily on week days.
Initial download of the metrics may take a while.