Fig. 6.
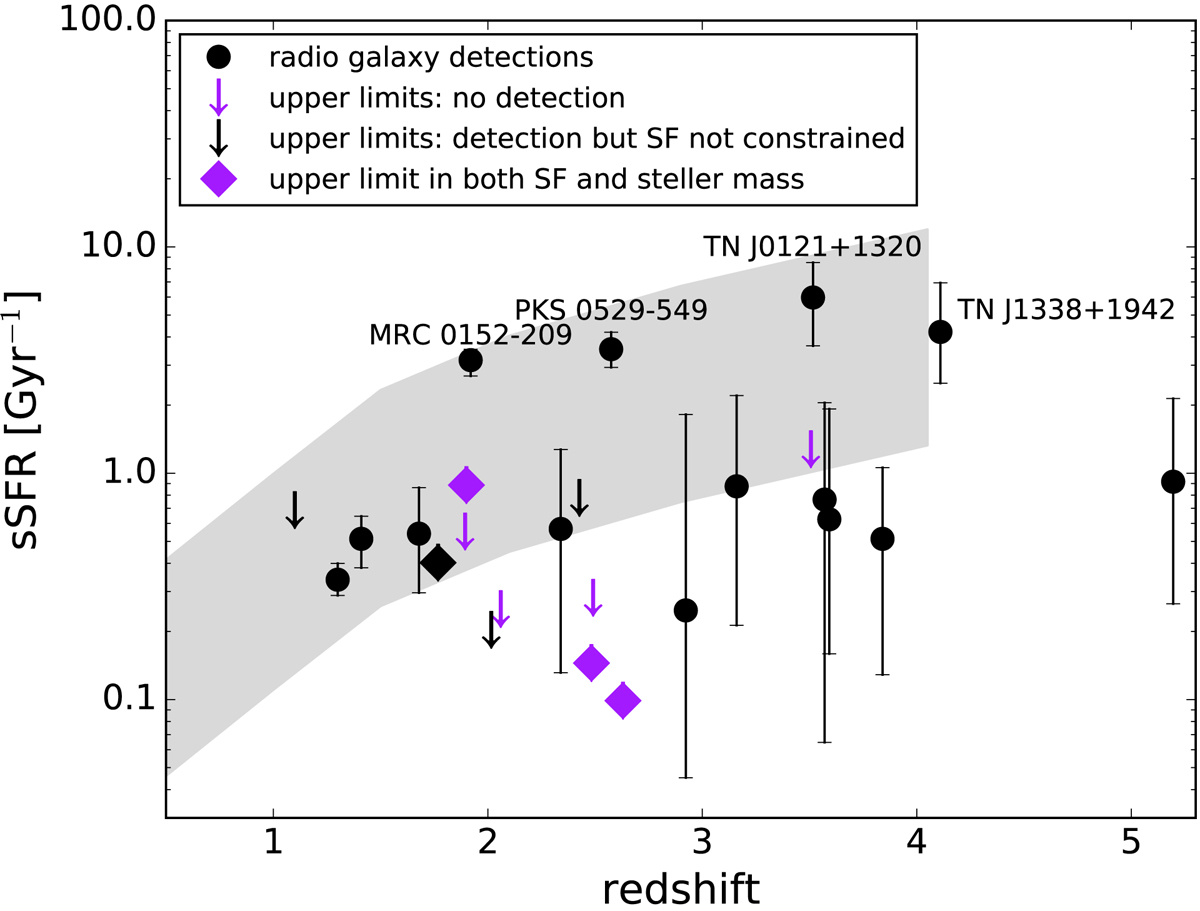
Specific star formation rate, sSFR (Gyr−1), as a function of redshift. The black filled circles, black arrows and purple arrows represent the radio galaxies of our sample that are detected, detected but with unconstrained SF component and undetected with ALMA, respectively. The diamonds indicate sources which have both upper limits on the stellar mass and the SFR. The shaded region shows the galaxy main sequence (adapted from Schreiber et al. 2015) for M* = 1011.33 M⊙. We only indicate the redshift range 0.5 < z < 4 in the shaded region as z = 4 is the redshift limit of the objects studied in (Schreiber et al. 2015). We do not extrapolate to higher redshifts (Stark et al. 2013).
Current usage metrics show cumulative count of Article Views (full-text article views including HTML views, PDF and ePub downloads, according to the available data) and Abstracts Views on Vision4Press platform.
Data correspond to usage on the plateform after 2015. The current usage metrics is available 48-96 hours after online publication and is updated daily on week days.
Initial download of the metrics may take a while.