Fig. 5.
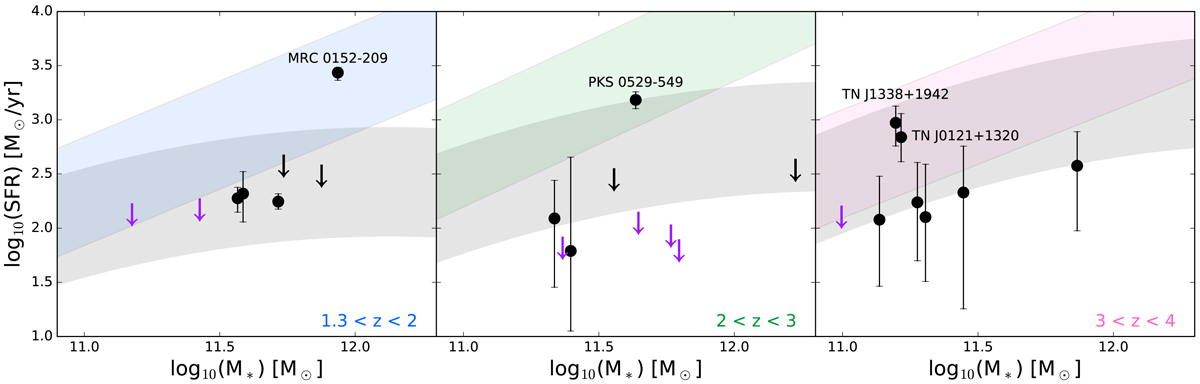
Relationship between the SFR and stellar mass for different redshift bins. The colored shaded regions shows the MS of Santini et al. (2017) for each respective redshift bins with a 0.3 dex scatter around the MS. The gray shaded regions shows the MS with a 0.3 dex scatter from Schreiber et al. (2015), with a turnover at higher stellar masses. Our stellar masses have been scaled from a Kroupa to a Salpeter IMF to be consistent with the IMF used to make the MS in this comparison. In the highest redshift bin, 3 < z < 4, two sources, TN J1338+1942 and TNJ0924−2201, have been added to the right most panel despite having redshifts outside of the range used to construct the MS (z = 4.110 and 5.195 respectively). Given the redshift dependence on the normalization of the MS, these galaxies may lie relatively lower in comparison with the mean relation of a MS derived using galaxies over a more appropriate, higher redshift range (see Fig. 6).
Current usage metrics show cumulative count of Article Views (full-text article views including HTML views, PDF and ePub downloads, according to the available data) and Abstracts Views on Vision4Press platform.
Data correspond to usage on the plateform after 2015. The current usage metrics is available 48-96 hours after online publication and is updated daily on week days.
Initial download of the metrics may take a while.