Fig. 4.
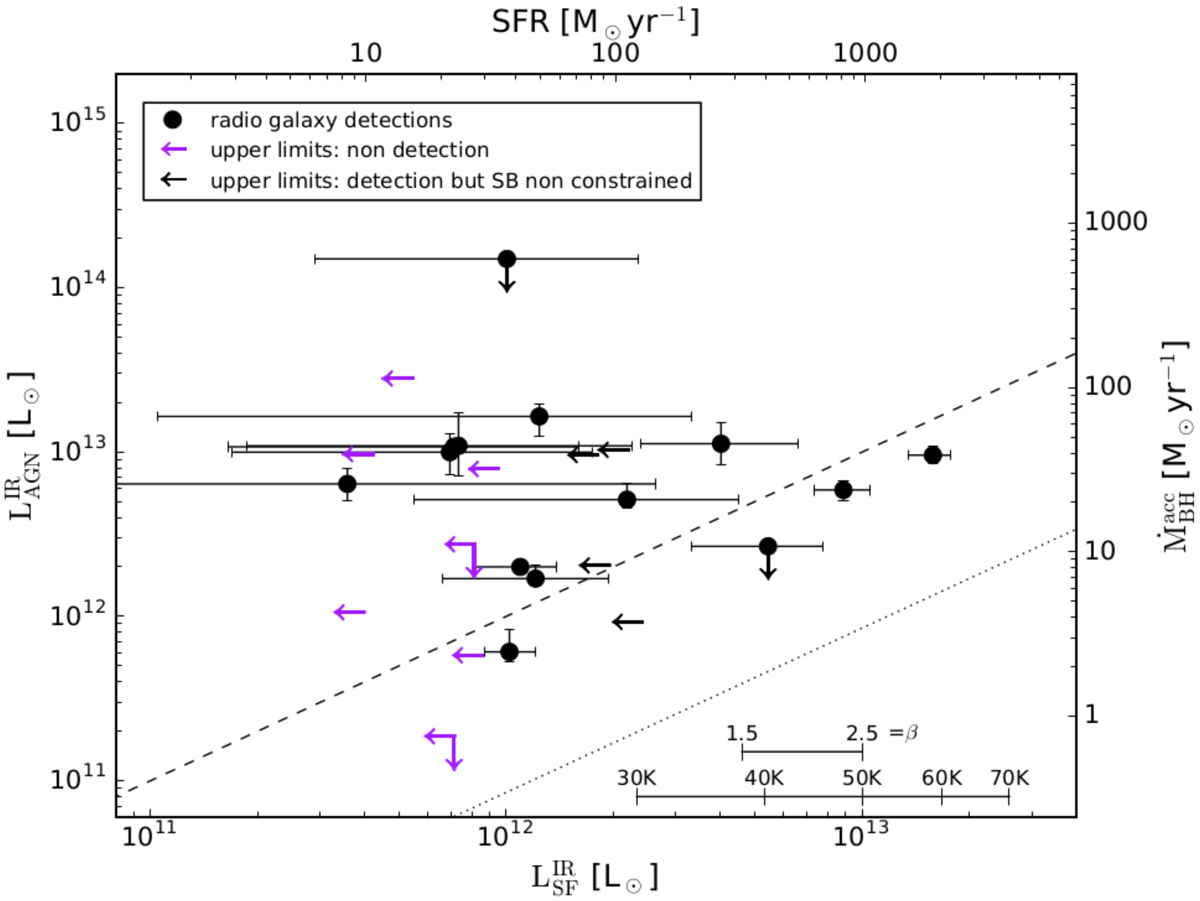
Estimated AGN luminosity, ![]() , versus the SF luminosity,
, versus the SF luminosity, ![]() . The dashed black line indicates the values where
. The dashed black line indicates the values where ![]() , while the dotted black line indicates parallel growth of the stellar mass and black hole mass,
, while the dotted black line indicates parallel growth of the stellar mass and black hole mass, ![]() . Filled black circles are galaxies detected with ALMA and with constrained SF and AGN luminosity estimates. Purple arrows are sources with upper limit in the ALMA band. The upper limits of
. Filled black circles are galaxies detected with ALMA and with constrained SF and AGN luminosity estimates. Purple arrows are sources with upper limit in the ALMA band. The upper limits of ![]() are approximated by scaling a modified blackbody to the 3-σ upper limit estimated assuming β = 2.5 and T = 50 K. We assumed β = 2.5 for all of our fits and 50 K is approximately the medium temperature of our best fits (Table 5). Black arrows indicate galaxies which are detected in ALMA but where the observed ALMA flux(es) are consistent with an extrapolation of the lower frequency synchrotron emission implying little or no contribution from thermal dust emission. We indicate with bars in the lower right corner of the plot, how the upper limits of the
are approximated by scaling a modified blackbody to the 3-σ upper limit estimated assuming β = 2.5 and T = 50 K. We assumed β = 2.5 for all of our fits and 50 K is approximately the medium temperature of our best fits (Table 5). Black arrows indicate galaxies which are detected in ALMA but where the observed ALMA flux(es) are consistent with an extrapolation of the lower frequency synchrotron emission implying little or no contribution from thermal dust emission. We indicate with bars in the lower right corner of the plot, how the upper limits of the ![]() would shift if one of the fixed parameters, β or T, are changed with respect to our assumed values of β = 2.5 and T = 50 K.
would shift if one of the fixed parameters, β or T, are changed with respect to our assumed values of β = 2.5 and T = 50 K.
Current usage metrics show cumulative count of Article Views (full-text article views including HTML views, PDF and ePub downloads, according to the available data) and Abstracts Views on Vision4Press platform.
Data correspond to usage on the plateform after 2015. The current usage metrics is available 48-96 hours after online publication and is updated daily on week days.
Initial download of the metrics may take a while.