Fig. 3.
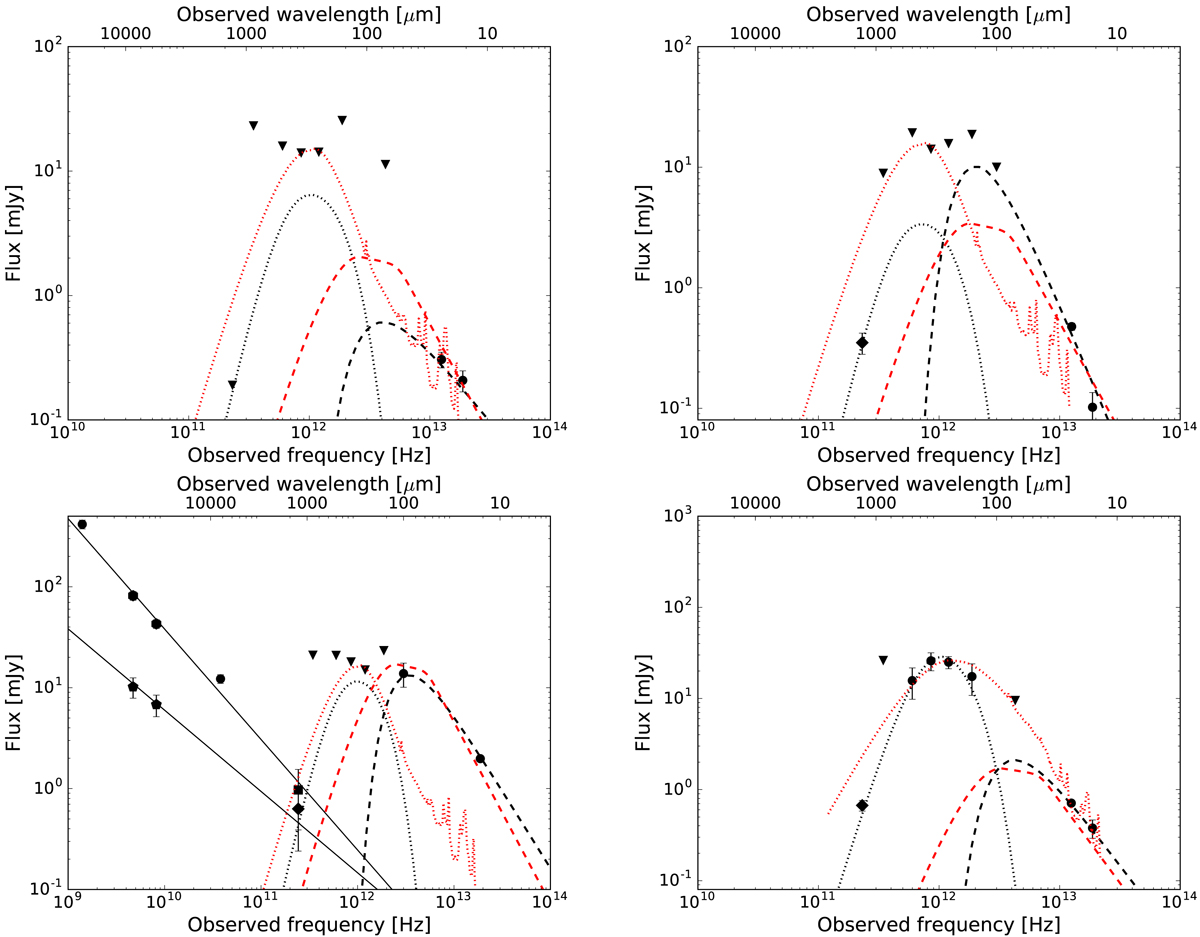
Model comparison between the SF and AGN models of this paper and Drouart et al. (2014) for galaxies MRC 0350−279 (top left panel), MRC 0251−273 (top right panel), MRC 0156−252 (bottom left panel) and MRC 0211−256 (bottom right panel). In each plot, the black solid lines represent the synchrotron emission, dotted lines indicate the FIR thermal emission due to star-formation, and dash-dotted indicates the best-fit MIR emission due to the AGN as determined from the best fits to the photometry for each galaxy. The red lines with the same styles represent the same components as fitted in Drouart et al. (2014) A synchrotron power-law was not fit in the analysis of Drouart et al. (2014)
Current usage metrics show cumulative count of Article Views (full-text article views including HTML views, PDF and ePub downloads, according to the available data) and Abstracts Views on Vision4Press platform.
Data correspond to usage on the plateform after 2015. The current usage metrics is available 48-96 hours after online publication and is updated daily on week days.
Initial download of the metrics may take a while.