Fig. A.16.
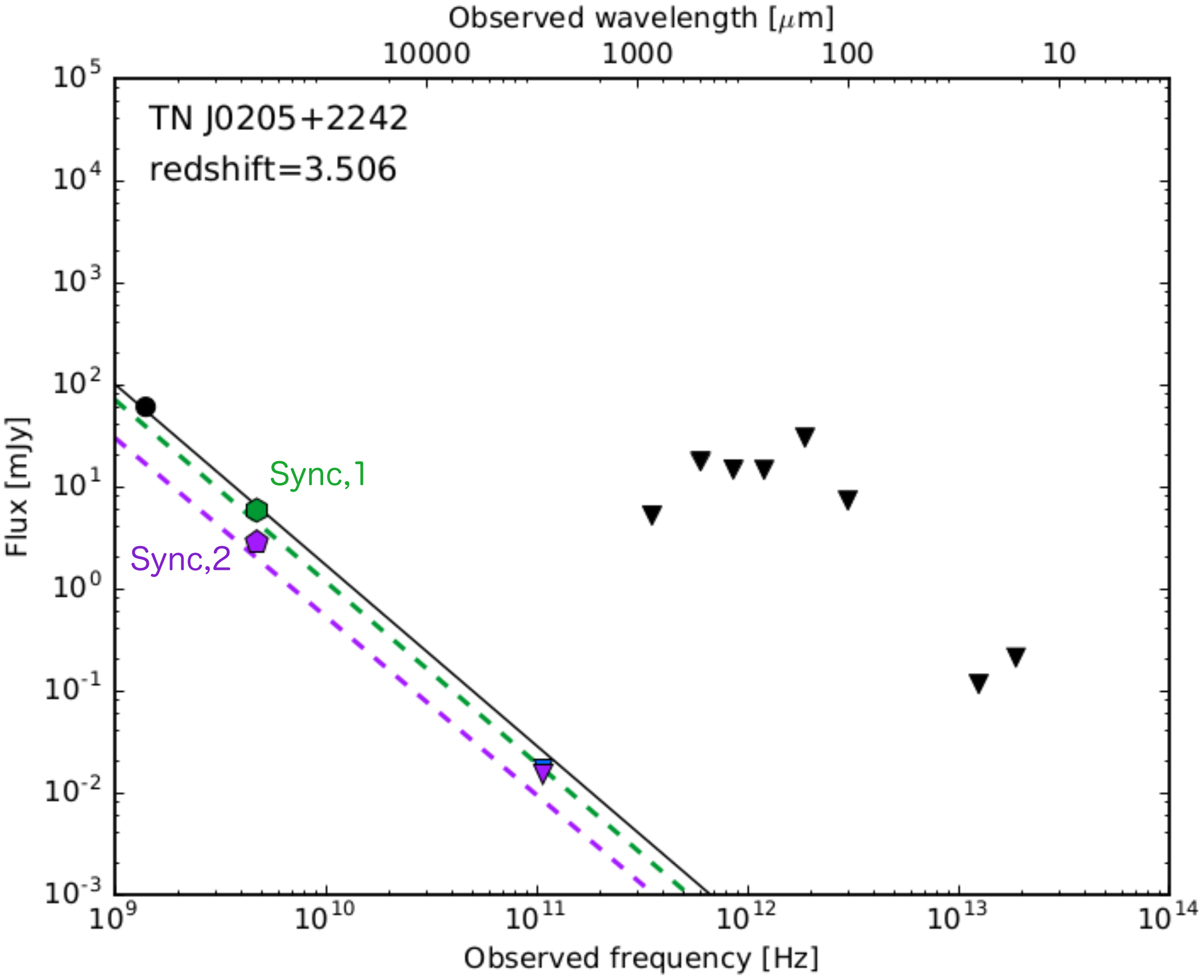
SED of TN J0205+2242. Black solid line shows best fit total model, green and purple dashed line is the north and south synchrotron, respectively. The colored data points are sub-arcsec resolution data and black ones indicated data of low resolution. The blue and purple downward pointing triangles indicates the ALMA band 3 upper limits at the location of the two radio lobes, where the blue triangle is the upper limit of the host galaxy and the north synchrotron component. Filled black circles indicate detections (> 3σ) and downward pointing triangles the 3σ upper limits (Table A.6).
Current usage metrics show cumulative count of Article Views (full-text article views including HTML views, PDF and ePub downloads, according to the available data) and Abstracts Views on Vision4Press platform.
Data correspond to usage on the plateform after 2015. The current usage metrics is available 48-96 hours after online publication and is updated daily on week days.
Initial download of the metrics may take a while.