Fig. A.14.
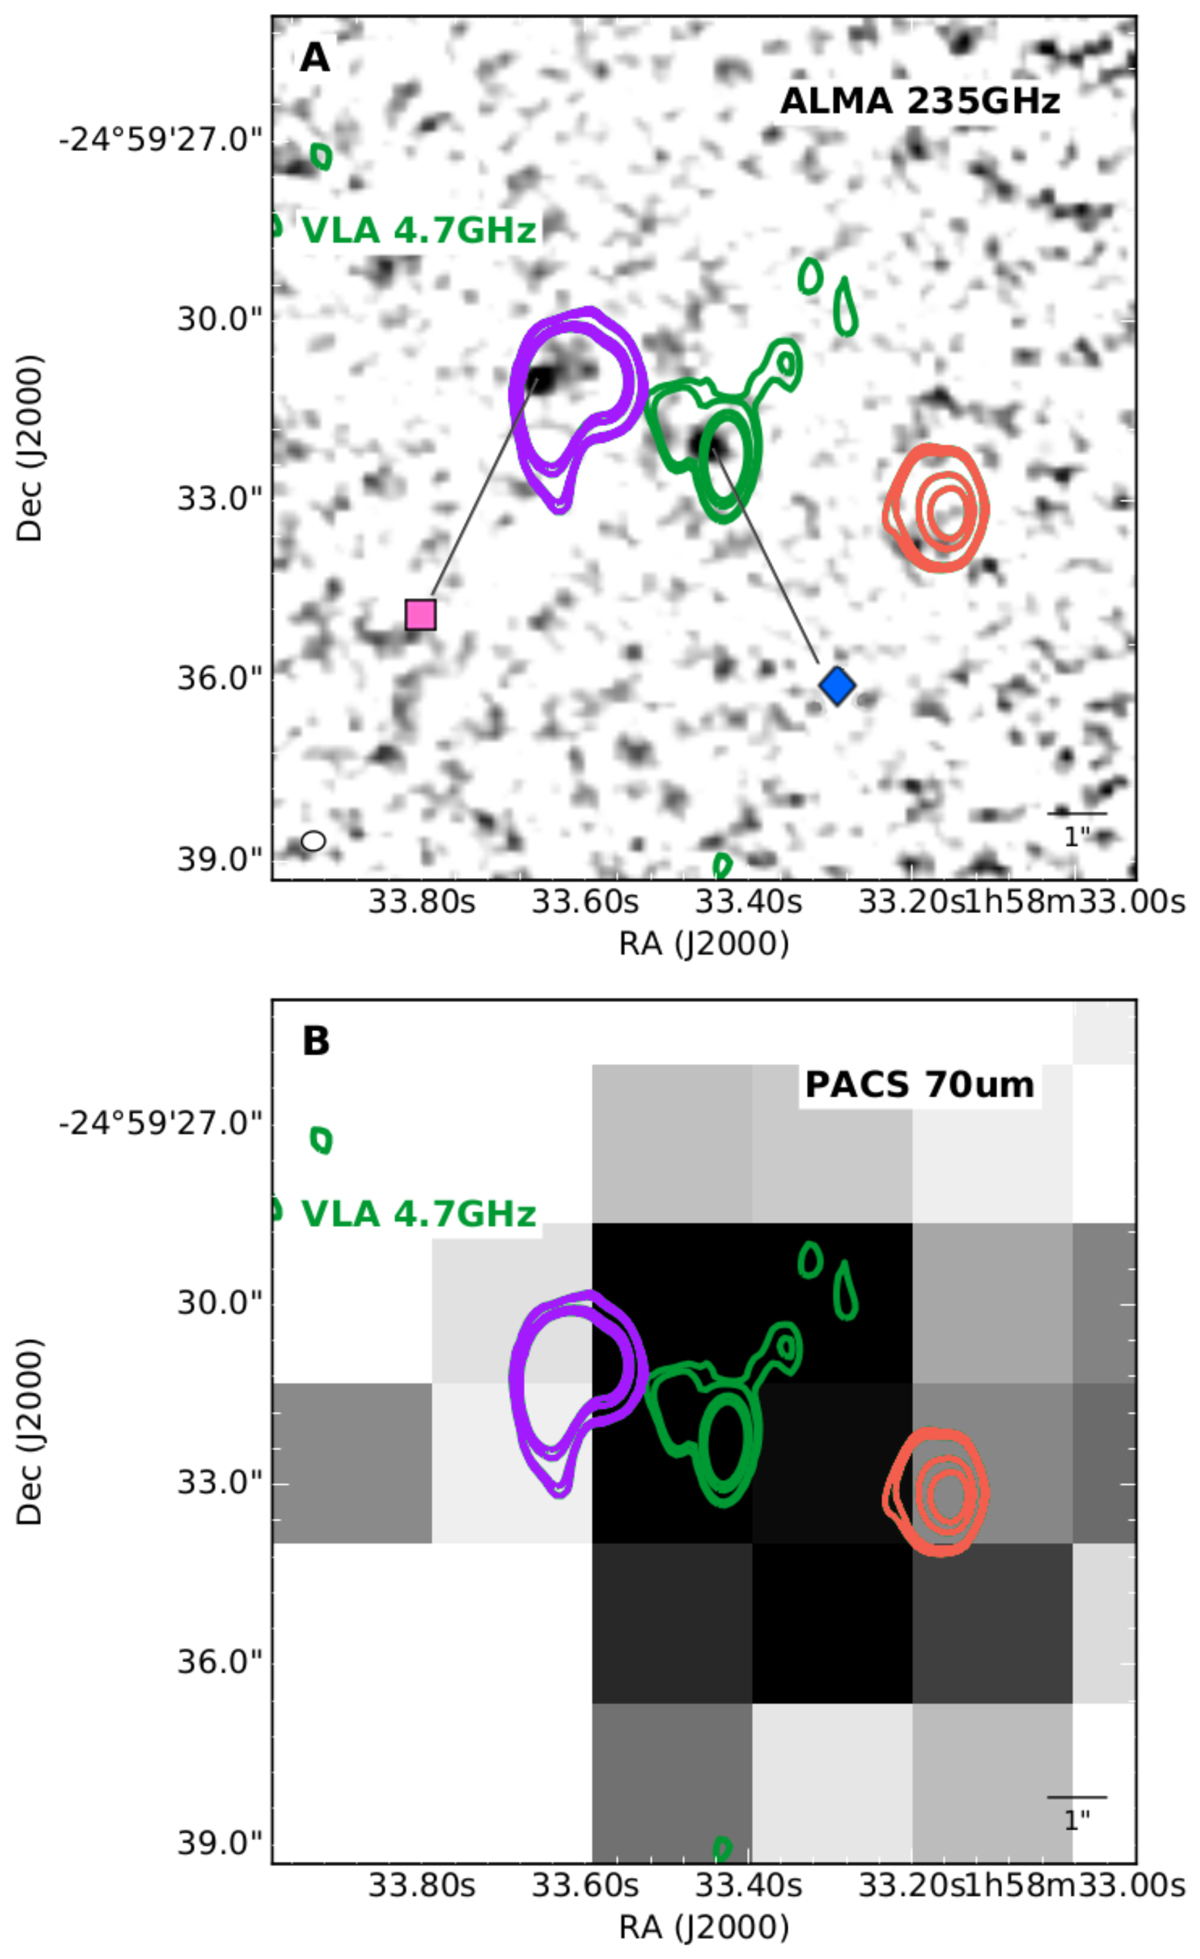
Panel A: continuum map of ALMA band 6 with overlaid VLA C contours (levels are as Fig. A.2, σ = 96 μJy). The blue and pink markers show the two ALMA detections and correspond to the same markers used for the SED in Fig A.13. The core and northern radio lobes are color coded in the same colors as the flux markers in Fig. A.10, the flux of the southern lobe (red radio contours) was not used in the SED fit. Panel B: PACS 70 μm continuum map with radio contours overlaid.
Current usage metrics show cumulative count of Article Views (full-text article views including HTML views, PDF and ePub downloads, according to the available data) and Abstracts Views on Vision4Press platform.
Data correspond to usage on the plateform after 2015. The current usage metrics is available 48-96 hours after online publication and is updated daily on week days.
Initial download of the metrics may take a while.