Fig. A.5.
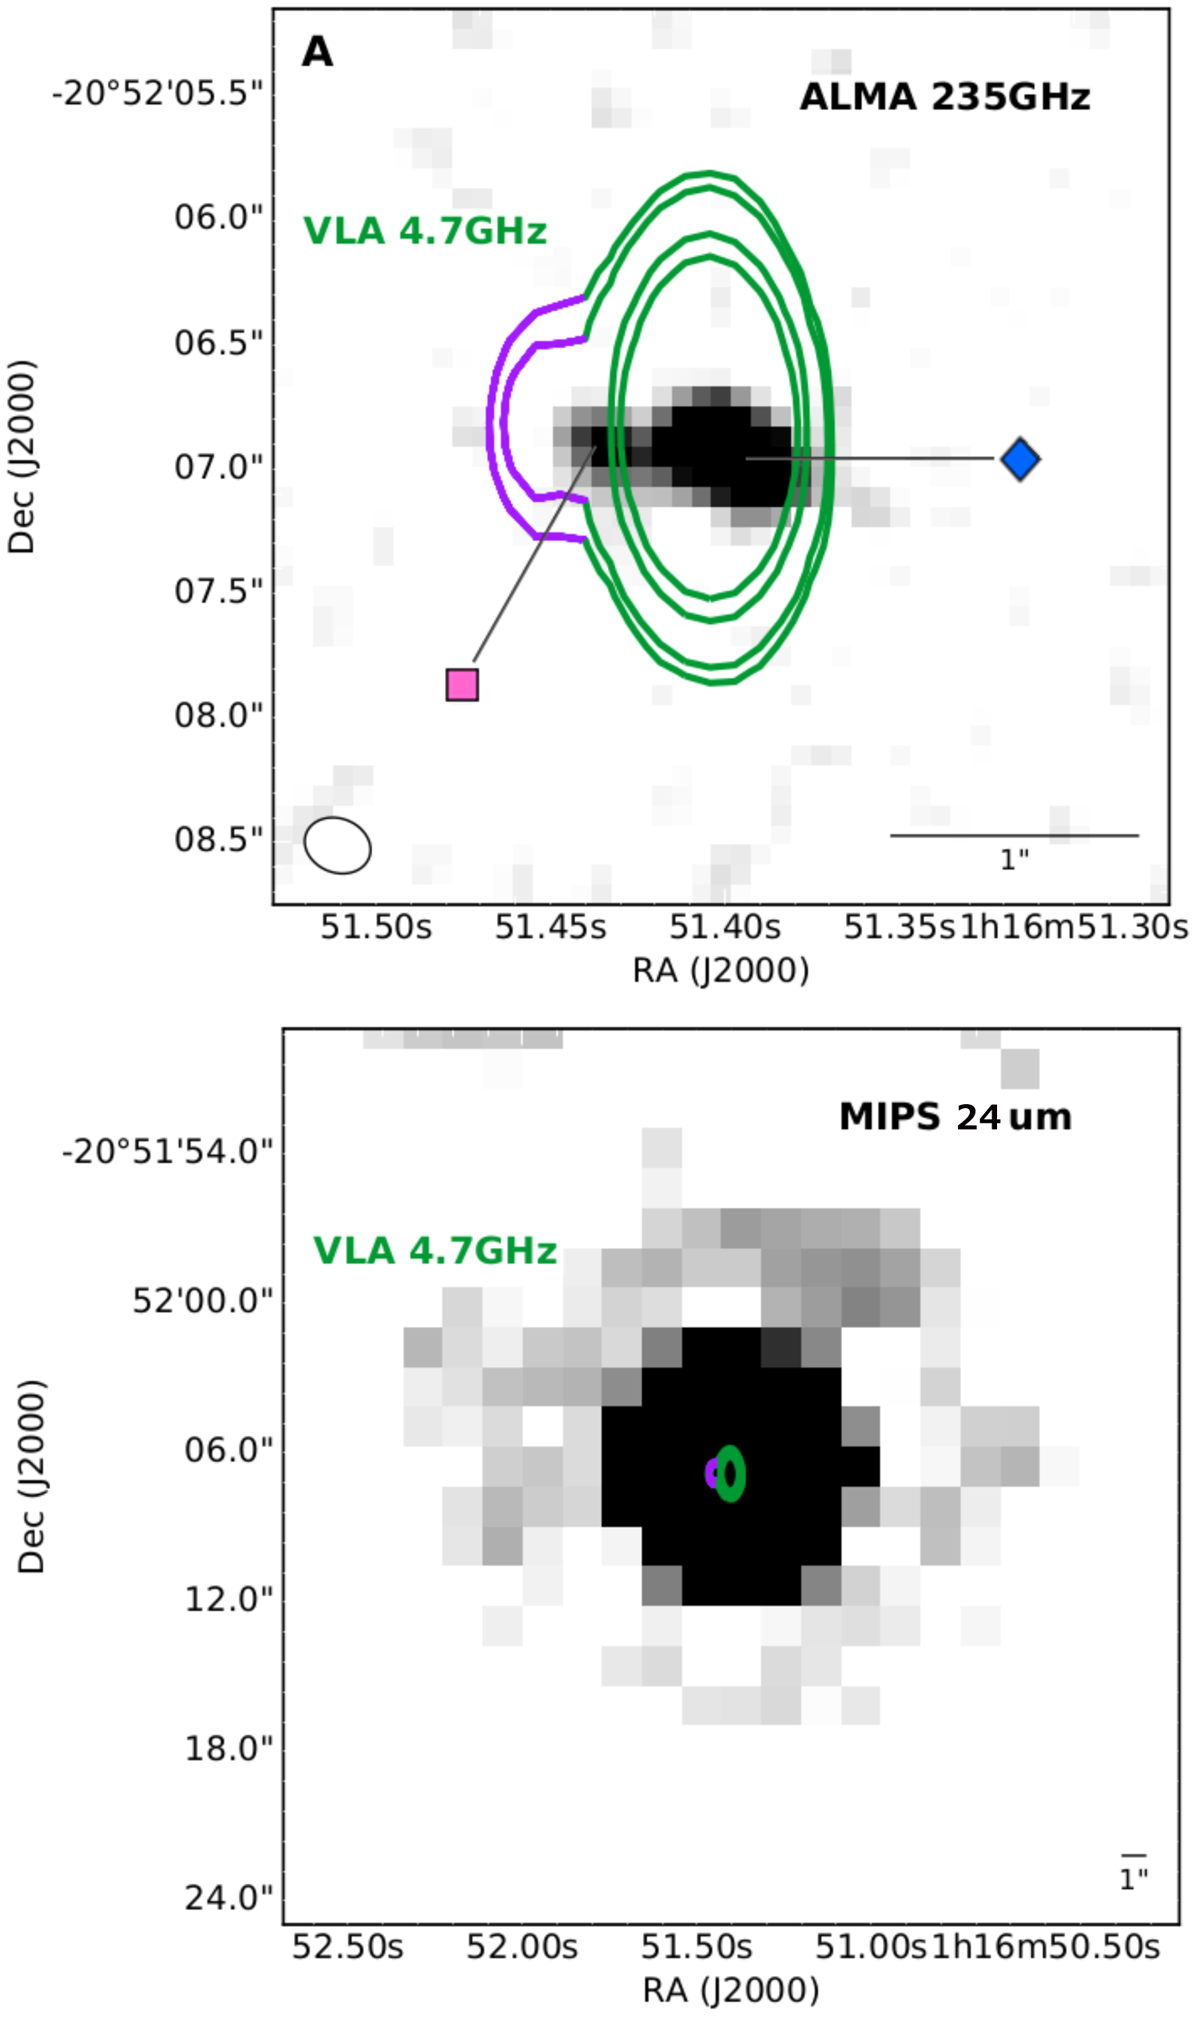
Panel A: continuum map of ALMA band 6 with VLA C contours overlaid (levels are as Fig. A.2; σ = 71 μJy). The blue and pink markers indicate the two different components detected with ALMA and correspond to the same data points as Fig. A.4. The purple and green contours show the two components of the VLA data and correspond to the markers of the same colors as in the SED fit. Panel B: MIPS 24 μm continuum map with VLA 4.7 GHz contours overlaid. We note that the scale of the MIPS image is five times larger than the image displayed in panel A.
Current usage metrics show cumulative count of Article Views (full-text article views including HTML views, PDF and ePub downloads, according to the available data) and Abstracts Views on Vision4Press platform.
Data correspond to usage on the plateform after 2015. The current usage metrics is available 48-96 hours after online publication and is updated daily on week days.
Initial download of the metrics may take a while.