Fig. 8
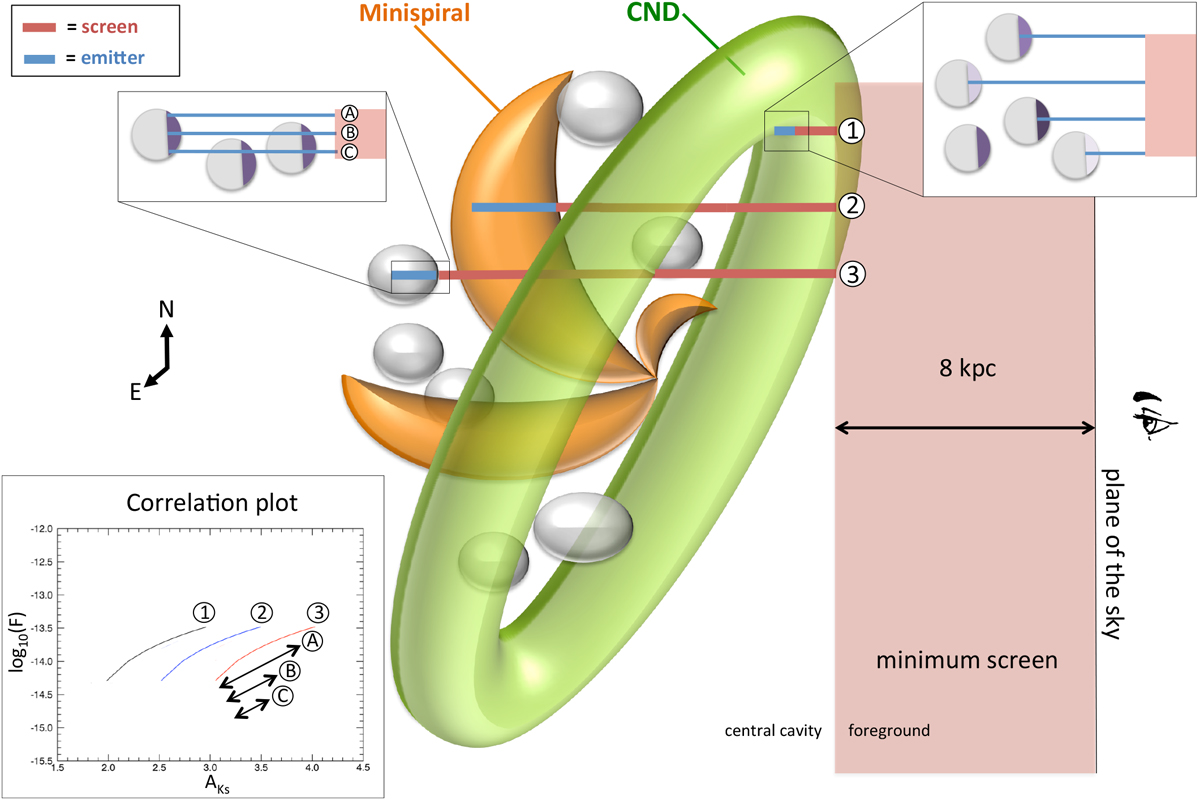
Representation of the central parsecs along the line of sight. The CND is represented in green, the Minispiral in brown. The clumps of gas and dust in the central cavity are shown in gray. The foreground, purely absorbant “screen” extinction (τ0) is represented in red, the local (τ) effect of mixed dust and gas (providing for both emission and extinction) is shown in blue. The correlation plot in the bottom-left corner shows the models representing the cases marked on the figure.
Current usage metrics show cumulative count of Article Views (full-text article views including HTML views, PDF and ePub downloads, according to the available data) and Abstracts Views on Vision4Press platform.
Data correspond to usage on the plateform after 2015. The current usage metrics is available 48-96 hours after online publication and is updated daily on week days.
Initial download of the metrics may take a while.