Fig. 7
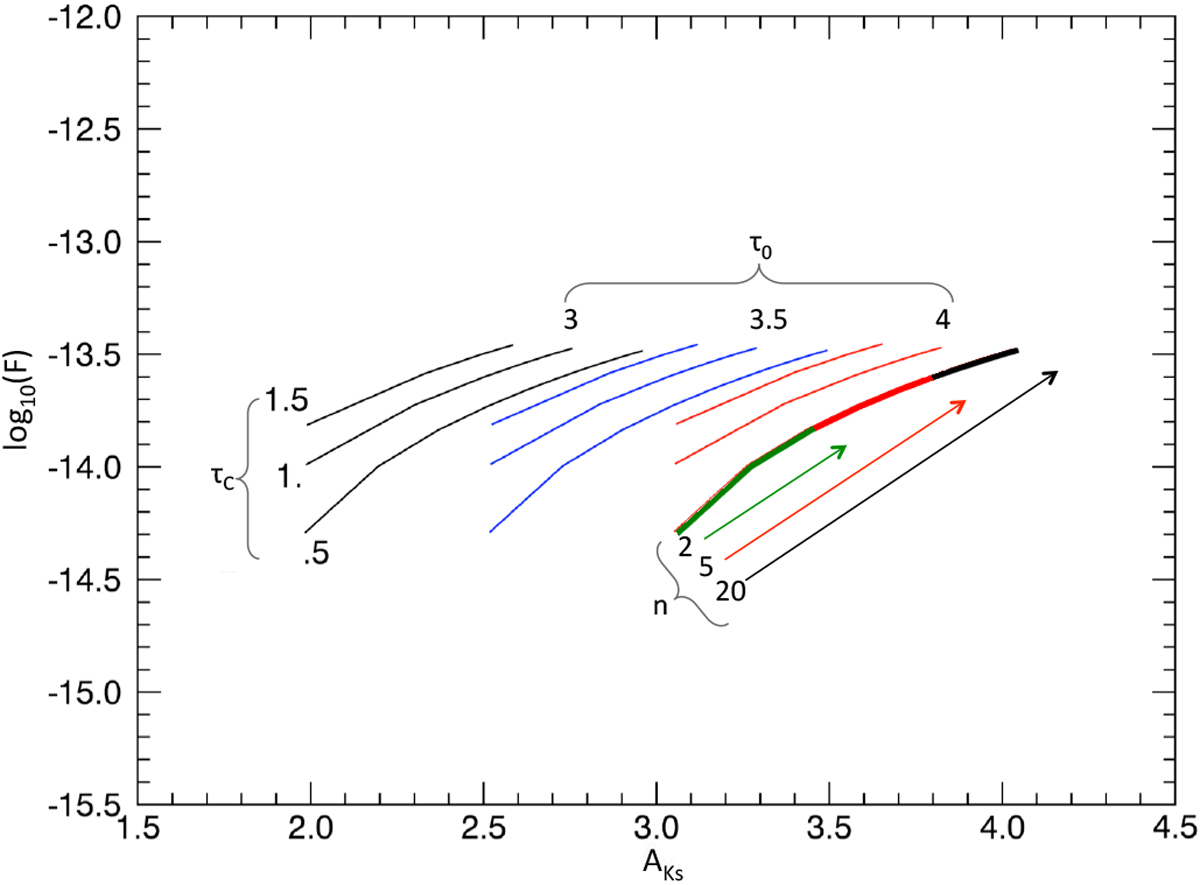
Models from scenario B for different values of the clump absorption coefficient τC and differentforeground screen depths: τ0 = 3 (black), 3.5 (blue), 4 (red). The variation of τC has theeffect of expanding the dynamic range covered by the model. The variation of τ0 shifts the curve to higher extinction values. For τ0 = 4 the model is traced for 20 (black), 5 (red), and 2 (green) clumps with τC = 0.5 each. Models overlap on the plot and, in fact, all start from the same value. The 20-clump model is the one which covers the whole dynamics. The models reproduce the fact that increasing the number of clumps on the line of sight has the effect of enhancing both the flux and the extinction as observed.
Current usage metrics show cumulative count of Article Views (full-text article views including HTML views, PDF and ePub downloads, according to the available data) and Abstracts Views on Vision4Press platform.
Data correspond to usage on the plateform after 2015. The current usage metrics is available 48-96 hours after online publication and is updated daily on week days.
Initial download of the metrics may take a while.