Fig. 6
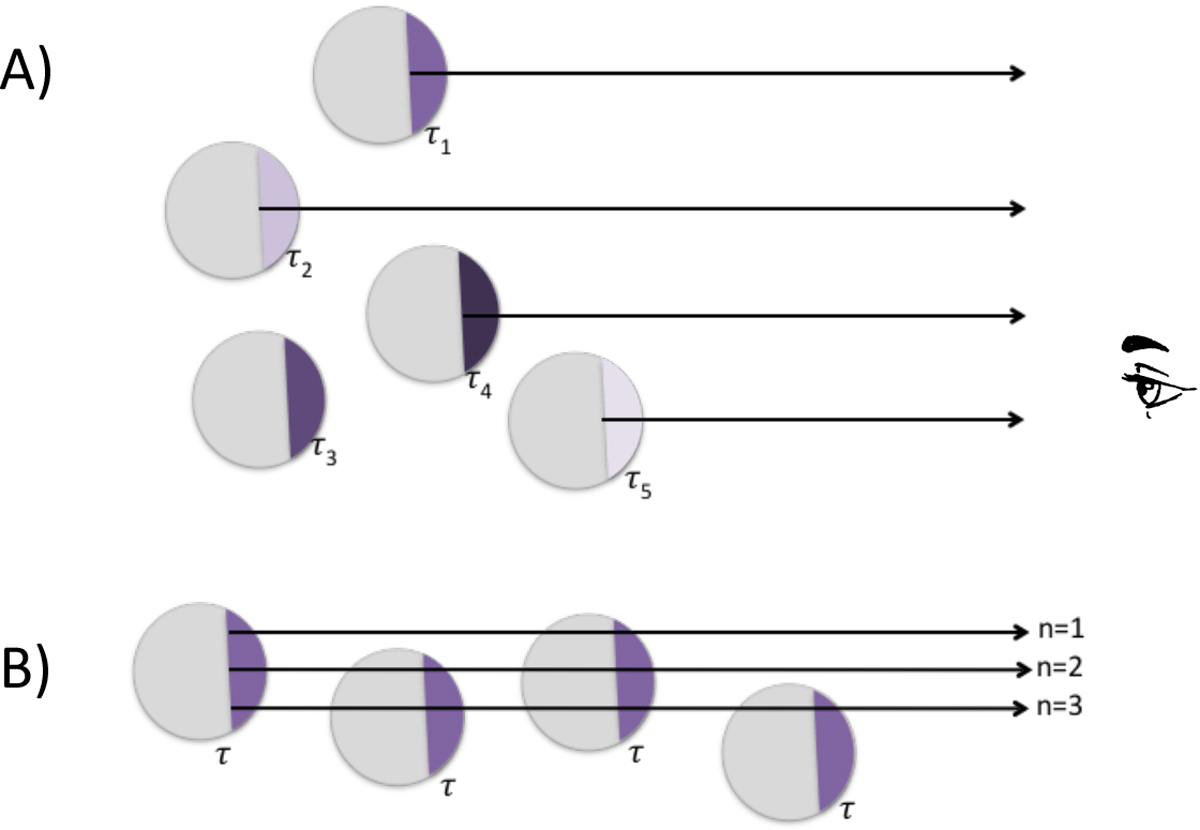
Illustrations of the two scenarios for the flux-extinction correlation. In both cases, the H2 emission arises from the thin external shell of clumps. In scenario A, these clumps are optically thick to H2 emission and the emitting shells have variable optical depth (τ1≠τ2≠τ3≠τ4≠τ5). In this case, only the most external clumps are visible (1, 2, 4, 5, but not 3). In scenario B, the clumps are optically thin and are all identical, with optical depth of the emitting shell τ = τC ∕100. In this case, the emission coming from a background clump is still visible, provided that there are not too many clumps on the line of sight.
Current usage metrics show cumulative count of Article Views (full-text article views including HTML views, PDF and ePub downloads, according to the available data) and Abstracts Views on Vision4Press platform.
Data correspond to usage on the plateform after 2015. The current usage metrics is available 48-96 hours after online publication and is updated daily on week days.
Initial download of the metrics may take a while.