Free Access
Fig. 5
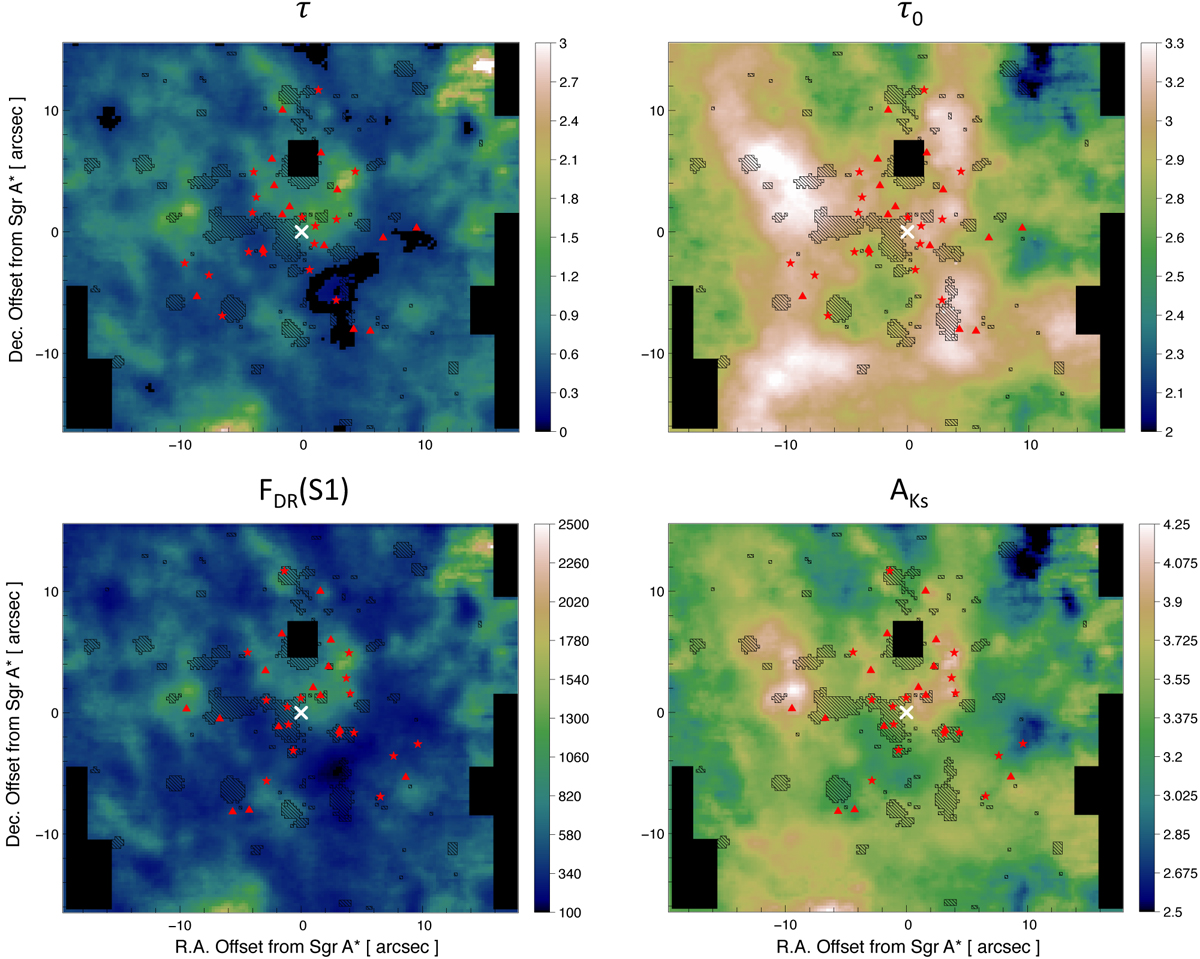
Top panels: 2D representation of τ (local extinction; left panel) and τ0 (screen extinction; right panel) obtained through the simplified model. These maps closely resemble the dereddened flux (bottom left panel) map and AKs map (bottom right panel), respectively (bottom images are from Ciurlo et al. 2016).
Current usage metrics show cumulative count of Article Views (full-text article views including HTML views, PDF and ePub downloads, according to the available data) and Abstracts Views on Vision4Press platform.
Data correspond to usage on the plateform after 2015. The current usage metrics is available 48-96 hours after online publication and is updated daily on week days.
Initial download of the metrics may take a while.