Fig. 2

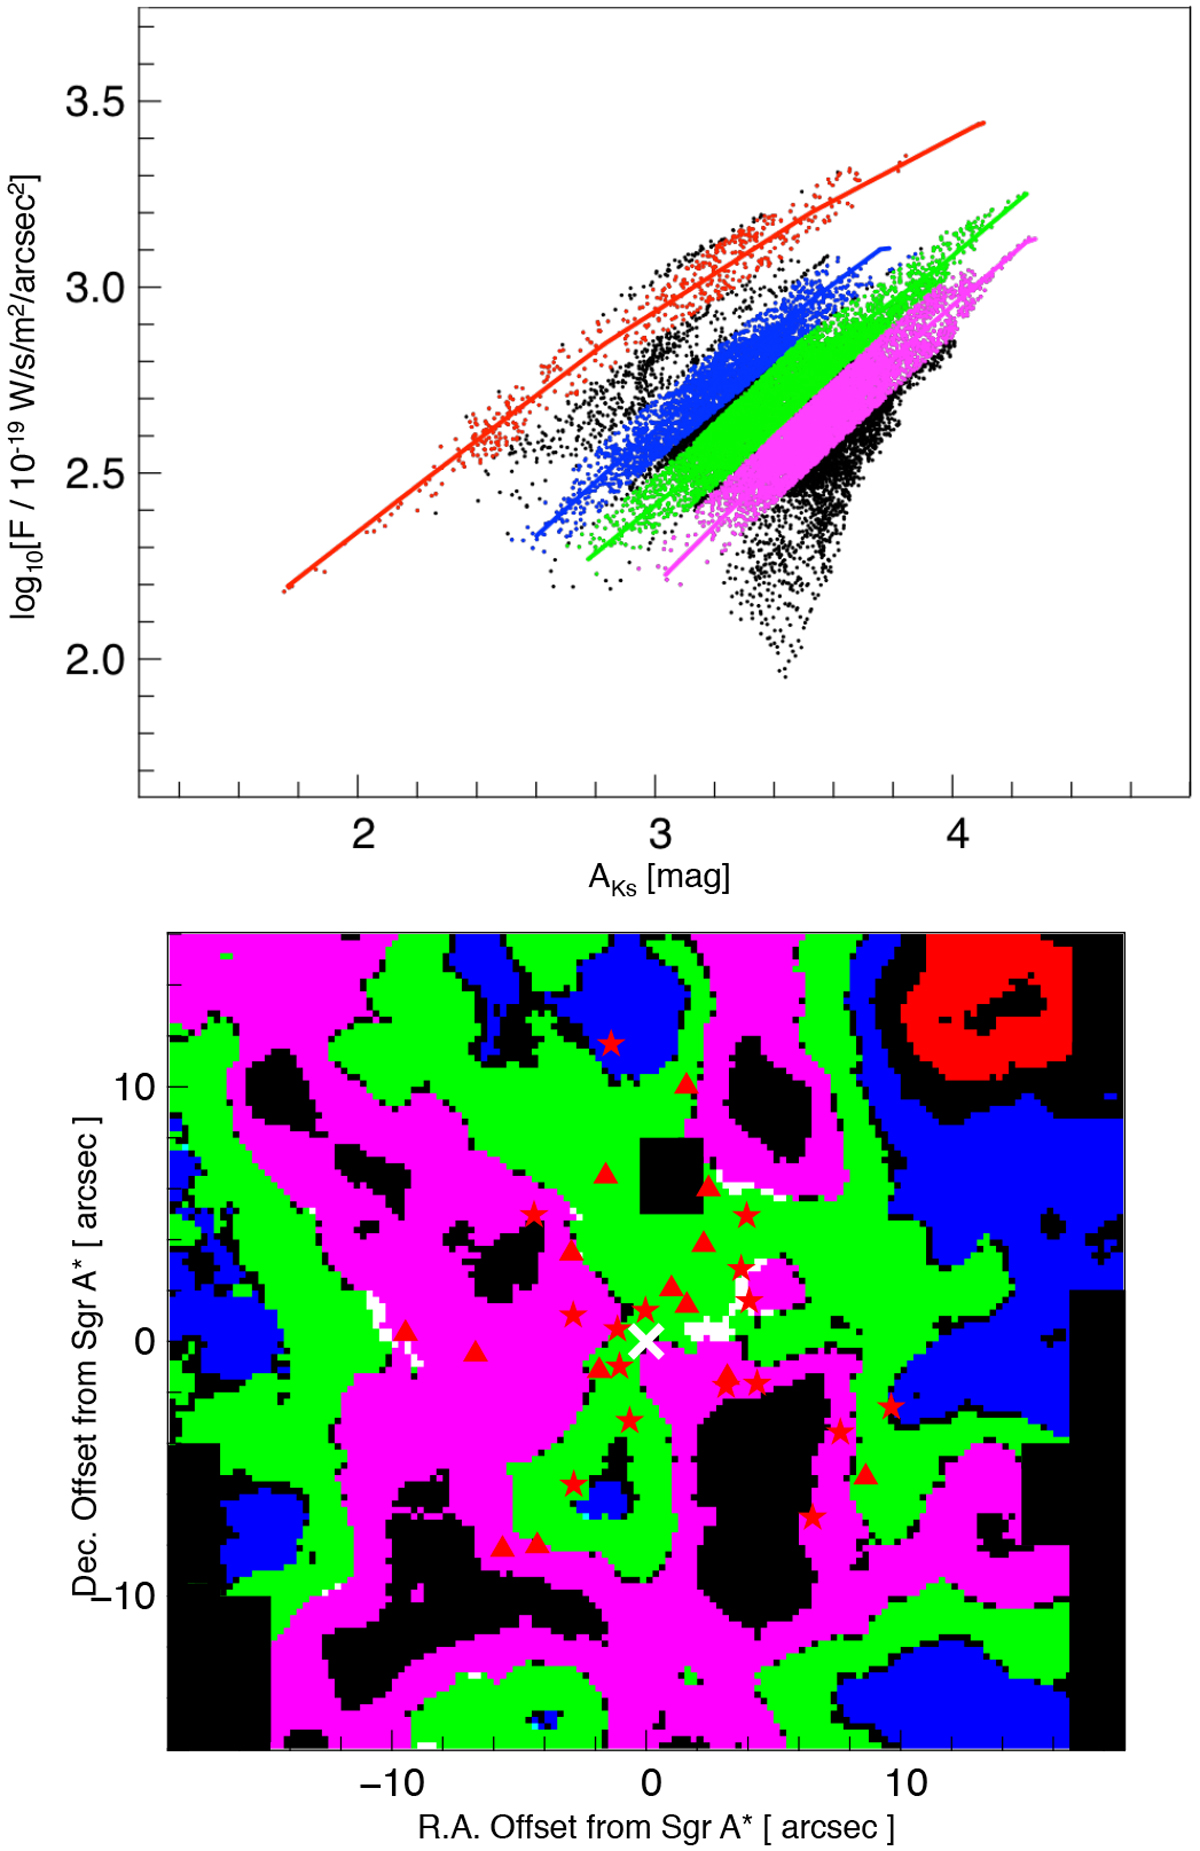
Top panel: as in Fig. 1. The groups of correlated points are identified by different colors. Bottom panel: spatial distribution of the correlated group of points. Each pixel is colored according to the set it belongs to. White pixels indicate where the green and magenta groups overlap and black pixels where there is no coverage by any of the selected groups. Sgr A* is indicated by the white cross. Red symbols indicate the position of Wolf-Rayet stars: stars for type WN and triangles for type WC (Paumard et al. 2006 catalog). The solid black squared areas indicate regions where we lack observations. GCIRS 7 is covered by the central black square.
Current usage metrics show cumulative count of Article Views (full-text article views including HTML views, PDF and ePub downloads, according to the available data) and Abstracts Views on Vision4Press platform.
Data correspond to usage on the plateform after 2015. The current usage metrics is available 48-96 hours after online publication and is updated daily on week days.
Initial download of the metrics may take a while.


