| Issue |
A&A
Volume 620, December 2018
|
|
|---|---|---|
| Article Number | L13 | |
| Number of page(s) | 5 | |
| Section | Letters to the Editor | |
| DOI | https://doi.org/10.1051/0004-6361/201834572 | |
| Published online | 14 December 2018 | |
Letter to the Editor
Discovery of accretion-driven pulsations in the prolonged low X-ray luminosity state of the Be/X-ray transient GX 304–1
Anton Pannekoek Institute for Astronomy, University of Amsterdam, Science Park 904, 1098 XH Amsterdam, The Netherlands
e-mail: This email address is being protected from spambots. You need JavaScript enabled to view it.
Received:
4
November
2018
Accepted:
27
November
2018
Abstract
We present our Swift monitoring campaign of the slowly rotating neutron star Be/X-ray transient GX 304–1 (spin period of ∼275 s) when the source was not in outburst. We found that between its type I outbursts, the source recurrently exhibits a slowly decaying low-luminosity state (with luminosities of 1034 − 35 erg s−1). This behaviour is very similar to what has been observed for another slowly rotating system, GRO J1008–57. For that source, this low-luminosity state has been explained in terms of accretion from a non-ionised (“cold”) accretion disc. Because of the many similarities between the two systems, we suggest that GX 304–1 enters a similar accretion regime between its outbursts. The outburst activity of GX 304–1 ceased in 2016. Our continued monitoring campaign shows that the source is in a quasi-stable low-luminosity state (with luminosities a few factors lower than previously seen) for at least one year now. Using our NuSTAR observation in this state, we found pulsations at the spin period, demonstrating that the X-ray emission is due to accretion of matter onto the neutron star surface. If the accretion geometry during this quasi-stable state is the same as during the cold-disc state, then matter indeed reaches the surface (as predicted) during this later state. We discuss our results in the context of the cold-disc accretion model.
Key words: X-rays: binaries / stars: neutron / accretion / accretion disks / pulsars: individual: GX 304–1
© ESO 2018
1. Introduction
In high-mass X-ray binaries, a compact object is accreting from a massive companion (with a mass of > 10 M⊙). The most common systems are the neutron star (NS) Be/X-ray transients in which magnetised NSs (with surface magnetic field strengths of B ∼ 1012 − 13 G) accrete matter from the decretion discs of their Be-type companions during outbursts (for a review, see Reig 2011). These systems can exhibit normal type I outbursts and in addition, sometimes giant type II outbursts. The type I outbursts occur at periastron passages when the NS moves through the decretion disc of the Be star and accretes matter. In these outbursts, sources exhibit X-ray luminosities (LX) of ∼ 1036 − 37 erg s−1. The type II outbursts are brighter than the normal ones and can reach luminosities of ∼ 1038 − 39 erg s−1. Their duration is also longer than type I outbursts, generally lasting more than an orbital period. The nature of the mechanism(s) behind these type II outbursts is unclear (for possible models, see Moritani et al. 2013; Martin et al. 2014; Monageng et al. 2017; Laplace et al. 2017).
The high luminosities exhibited by Be/X-ray transients during outbursts allow for detailed studies of their behaviour. Consequently, their outburst phenomenology is well known. When not in outburst, their luminosities are significantly lower, and studying their behaviours becomes more difficult. However, it is clear that the NS spin and magnetic field play important roles in the phenomenology that these systems display at low luminosities. It is expected that below a certain accretion rate, matter can no longer reach the NS surface. This is due to the pressure exerted by the rotating NS magnetic field that expels the matter; the systems then enter the so-called propeller regime (Illarionov & Sunyaev 1975; Romanova et al. 2004; D’Angelo & Spruit 2010). After this, such systems may only exhibit very low luminosities (< 1033 erg s−1).
However, in the case of slowly rotating Be/X-ray transients (with typical spin periods Pspin of several tens of seconds and magnetic field strengths of 1012 − 13 G), it has been observed that several sources show an intermediate bright state (LX ∼ 1034 − 35 erg s−1) between their outbursts (e.g. Tsygankov et al. 2017a; Ducci et al. 2018; Reig & Zezas 2018). Tsygankov et al. (2017a) introduced a scenario to explain the observed X-ray emission during this state for the slowly rotating Be/X-ray transient GRO J1008–57 (Pspin ∼ 93.6 s; Stollberg et al. 1993). For such slowly rotating systems, below a certain accretion rate and before the matter of the accretion disc is ejected by the propeller effect, the temperature of the matter in this disc may drop below the ionisation temperature of hydrogen. This results in a disc with a low degree of ionisation (called a “cold disc”), which can penetrate the magnetic field more easily than a hot ionised disc. The cold disc can move relatively close to the NS before it becomes hot again, causing the matter to be channelled by the magnetic field to its poles. This might lead to observable pulsations (Tsygankov et al. 2017b). So far, the long-term evolution of the cold-disc state has been studied very little. In this Letter, we present our X-ray monitoring campaign of the Be/X-ray transient GX 304–1 when it was likely accreting from a cold disc.
GX 304–1 is located at a distance of  kpc1. Its NS has a spin period of ∼275 s (McClintock et al. 1977; Sugizaki et al. 2015)2 and a surface magnetic field strength of ∼4.7 × 10¹² G (Yamamoto et al. 2011; Rothschild et al. 2017). GX 304–1 is characterised by periods of strong activity wherein type I outbursts recur periodically with a period of ∼132.2 days (the orbital period; Sugizaki et al. 2015), and periods wherein the source exhibited hardly any to no activity (Priedhorsky & Terrell 1983; Pietsch et al. 1986; Sugizaki et al. 2015; Malacaria et al. 2017). In particular, the source remained dormant since the early 1980s to 2008, when it showed renewed activity (Manousakis et al. 2008). The last reported outburst occurred in May 2016 (Nakajima et al. 2016; Sguera & Sidoli 2016; Rouco Escorial & Wijnands 2016), and since then, the source has remained in a low-luminosity state (Fig. 1).
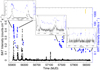 |
Fig. 1. BAT (15–50 keV; black circles) and XRT (0.5–10 keV; blue squares) light curves of GX 304–1 from January 1, 2012, to October 30, 2018. The time of our NuSTAR observation is indicated with the yellow lines. The three insets show the behaviour of the source during different states (see main text for details). Vertical lines correspond to periastron passages (determined using the ephemeris of Sugizaki et al. 2015). |
2. Observations, analysis, and results
We have monitored GX 304–1 using the X-ray Telescope (XRT; for ∼84.7 ks) on board the Neil Gehrels Swift observatory (hereafter Swift) to investigate its behaviour outside outbursts (ObsIDs 35072 and 88780). We have also intensively monitored the source since October 2017 when it became clear that its outburst activity had stopped. We also obtained a NuSTAR observation (Sect. 2.2) to study its spectrum above > 10 keV and search for pulsations during its low-luminosity state.
2.1. Light curves of GX 304–1
In Fig. 1 we show the light curves of the source obtained using the Burst Alert Telescope (BAT) on board Swift (from the BAT transient monitor web page3; Krimm et al. 2013) and the XRT (produced with the XRT products web interface4; Evans et al. 2009). In the left inset, we show the first two outbursts exhibited by the source in 2012. The maximum observed BAT count rates were ∼0.25 and ∼0.20 counts cm−2 s−1 for the first and the second outbursts, respectively (i.e. the second peak of the second outburst). The XRT was used to monitor the evolution of both outbursts and the interval between them. The maximum observed XRT count rates were ∼87 counts s−1 for the first outburst and ∼44 counts s−1 for the second one (i.e. for the first peak of this outburst). After the initial fast decay at the end of the first outburst, the source entered a state in which it decreased at a much slower rate: the XRT count rate dropped from ∼3.5 to ∼0.37 counts s−1 in ∼79 days (between MJD 55970 and 56049). No further count rate evolution could be investigated because the second outburst started. These count rates correspond to 0.5–100 keV luminosities of ∼2.7 × 1035 and 2.8 × 1034 erg s1, respectively. These luminosities were calculated using the spectral analysis and luminosities reported in Tsygankov et al. (2018), when the source was even fainter, and then scaled using our observed XRT count rates (see below; this assumes that the spectral shape does not change at such low luminosities; this is consistent with what we can infer from our low-quality XRT data).
Following the two outbursts reported above, a brighter one was detected around MJD 56234 (Fig. 1; with peak BAT count rate of ∼0.41 counts cm−2 s−1). After this outburst, several additional outbursts were observed, but none of them were as bright as those in 2012 (Fig. 1). No XRT data were obtained for several years during this period. However, on February 5, 2016 (MJD 57423), we obtained additional XRT observations after we noted a small outburst in the BAT on MJD 57415 (peaking at ∼0.89 × 10⁻² counts cm−2 s−1; Fig. 1, middle inset). This outburst was followed by a brighter outburst between MJD 57510 and 57550. The middle inset of Fig. 1 shows that the source behaviour between these two outbursts is similar to what we observed in 2012. The observed XRT count rate decreased from ∼1.5 (on MJD 57423) to ∼0.36 counts s−1 (on MJD 57506) in ∼83 days (corresponding 0.5–100 keV luminosities of ∼11.5 and ∼2.8 ×1034 erg s−1; using the method described earlier). This drop in count rate is lower than the one observed in between the 2012 outbursts because the count rate at the start of this phase was lower. However, the final count rates are remarkably similar. We note that the overall trend during the 2016 low-luminosity state appears less smooth and with more variability than what we observed in 2012.
After June 2016, GX 304–1 did not exhibit any detectable outbursts. When it was clear that the source indeed no longer exhibited outbursts (after a few orbital cycles), we started an additional XRT monitoring campaign (started on MJD 58011; September 15, 2017) to investigate the overall behaviour of the source (i.e to determine whether the source exhibited any increase in activity at periastron, and to determine if it would decay to fainter levels than previously observed). The results of our campaign are shown in the right inset in Fig. 1. We indeed observed the source at lower count rates than ever seen before, but we did not observe a clear overall trend in activity level (neither a decrease nor an increase). The source is quasi-stable (for over a year now) with count rates of ∼1–2.5 × 10⁻¹ counts s−1 with only a factor of 2–3 variability (this corresponds to 0.5–100 keV luminosities of ∼0.8–1.9 × 1034 erg s−1; determined using the method outlined above). Although it appears that the count rate increased slightly during the several periastron passages that we monitored, similar count rate increases were also observed at other orbital phases (i.e. also at apastron). Therefore, these fluctuations might be only random occurrences. Moreover, we planned our NuSTAR observation (Sect. 2.2) at apastron (to ensure that the source was not in outburst), and several XRT observations were scheduled close in time. The XRT count rate increased from ∼1.3 × 10⁻¹ counts s−1 (this XRT observation was simultaneous with our NuSTAR observation) to 2.6 × 10⁻¹ counts s−1 within only a day.
2.2. Timing analysis of the NuSTAR observation
We observed GX 304–1 using NuSTAR (Harrison et al. 2013) on June 3 (05:56:09 UTC), 2018, for ∼50 ks with the FPMA and FPMB detectors (ObsID 90401326002). This observation was obtained to investigate the spectral behaviour of the source above 10 keV (reported in Tsygankov et al. 2018) and to search for pulsations. We ran the NUPIPELINE task (with SAAMODE=strict and TENTACLE=yes because the background event rates were slightly high) to obtain clean event files and used the BARYCORR tool to perform the barycenter correction (using version 82 of the NuSTAR clock correction). Finally, we obtained the light curves by means of NUPRODUCTS. In both observations, we used a circular region of 30 arcsec to extract the source photons, and a 60 arcsec circular region for the background from a different chip (because of the background gradient that affected the chip where the source was located). Although we produced background-subtracted light curves, we restricted them to the 3–30 keV energy range as the background dominates the source above that energy.
We searched for pulsations in the NuSTAR observation using the phase-folding method introduced in Leahy et al. (1983), and used it as implemented in the FTOOL5EFSEARCH. Using a custom PYTHON script, we folded the light curve on a range of periods around the known period of ∼275 s. The best-fit period is defined as the period for which the χ 2 of the folded light curve with respect to a constant is maximum. We clearly detected pulsations in the combined FPMA and FPMB light curve at P = 275.12 ± 0.02 s (with 1σ error). The pulsations are present in both individual detectors and are consistent with the known period of GX 304–1. The error on the period was determined following the approach in Brumback et al. (2018b,a): using the best-fit period, we simulated 500 fake sets of an FPMA and an FPMB light curve. For each set, we repeated our analysis and measured the period in the simulated data. We adopted the standard deviation of the obtained best-fit periods as the 1σ error (as quoted above) on the measured period.
The light curve folded on the best-fitting period is shown in Fig. 2. The profile can be described by a combination of a cosine function and a harmonic at half the period. A fit with such a model is shown in Fig. 2 as the green dotted line. This combined model implies a fundamental amplitude of 19.3%, while the harmonic contributes 8.6%. Taking a model-independent view, from Fig. 2 we conclude that the waveform varies over a range of 0.72–1.25 times the mean count rate.
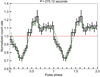 |
Fig. 2. NuSTAR combined FPMA and FPMB light curve (3–30 keV) folded on the best-fitting period of P = 275.12 s. The count rate has been normalised by dividing it by the mean count rate of 0.313 count s−1 (indicated by the red dashed line). The green dotted line shows the best-fitting model, which consists of a fundamental and one harmonic at twice the frequency. |
3. Discussion
We have reported on Swift/XRT observations of the Be/X-ray transient GX 304–1, which harbours a slow X-ray pulsar (∼275 s), obtained when the source was in between type I outbursts in 2012, and after these outbursts ceased in 2016. Additionally, we reported on the timing analysis of our NuSTAR observation in the latter period. At all times, the source was clearly detected at luminosities of ∼ 1034 − 35 erg s−1, which are significantly lower than those observed during outbursts, but still relatively high compared to the much fainter luminosities observed in other Be/X-ray transients when not in outburst (∼1032 − 33 erg s−1; Tsygankov et al. 2017b and references therein). However, such intermediate bright states have also been detected in several other slowly spinning systems (e.g. Haberl & Sturm 2016; Tsygankov et al. 2017a). So far, only for one system, GRO J1008–57, has this state been as well monitored (Tsygankov et al. 2017a) as we did for GX 304–1. Remarkably, the behaviour is very similar in the two sources: both exhibited luminosities in the range of ∼1034 − 35 erg s−1 that slowly declined between the adjacent type I outbursts (e.g. clearly visible when comparing the left inset in Fig. 1 with Fig. 1a in Tsygankov et al. 2017a). Therefore, it is quite likely that this behaviour is caused by the same physical mechanism in both sources.
Tsygankov et al. (2017a) suggested that during this state, the X-ray emission originates from accretion of matter down to the NS through a cold non-ionised disc. This state can only occur for systems with slowly spinning (with a spin of several tens of seconds or slower) and magnetised (∼1012 − 13 G) NSs, since only for such systems would the accretion disc become non-ionised before the propeller effect is initiated (see Sect. 1). Since GX 304–1 spins slowly at ∼275 s and its magnetic field is ∼4.7 × 10¹² G, we suggest that GX 304–1, similar to GRO J1008–57, was accreting from such a disc between its type I outbursts (as was proposed by Tsygankov et al. 2017a, see their Fig. 1a).
However, alternative physical scenarios have been proposed to explain the low-luminosity behaviour in Be/X-ray transients: the two main scenarios are the cooling emission from an accretion-heated NS crust and residual low-level accretion onto the NS surface even when the system is in the propeller regime. In the NS crust cooling scenario, the crust would have been heated by the accretion of matter during the preceding outburst, and in between outbursts, this crust would cool, resulting in observable emission. However, we observed GX 304–1 at luminosities of ∼1034 erg s−1 , which are at least one order of magnitude higher than those observed in systems that might indeed have exhibited such crust cooling behaviour (LX ∼ 1032 − 33 erg s−1; e.g. Wijnands & Degenaar 2016 and Rouco Escorial et al. 2017; see the review by Wijnands et al. 2017). In addition, we observed short-term variability (on timescales of days) for GX 304–1, which is not expected in the cooling scenario. Therefore, we do not think that we observed NS crust cooling emission in GX 304–1.
The other main alternative model to explain low-level emission in between outbursts is that in which the systems have entered the propeller regime but matter might still reach the surfaces of the NSs (i.e. as a result of leaking matter through the magnetosphere, although how exactly this would work is not fully understood; e.g. Orlandini et al. 2004; Mukherjee & Paul 2005; Rothschild et al. 2013; Doroshenko et al. 2014). For this model to work, the source has to have entered the propeller regime, but this would only occur for GX 304–1 at luminosities of < 2 × 1032 erg s−1 (using Eq. (4) of Tsygankov et al. 2017a with an NS mass of 1.4 M⊙ and a radius of 10 km), which is significantly lower than the actual luminosities we observed for this source. Therefore, this is probably likewise not a viable model to explain our observed emission, and we conclude that the cold-disc hypothesis is the most compelling explanation for the low-luminosity state in GX 304–1.
In the case of GX 304–1, we have now also determined that this low-luminosity cold-disc state is a recurrent phenomenon because we have now observed it in between two sets of type I outbursts (Fig. 1). During the outbursts, the accretion disc around the NS most likely fills up again to such a degree that once the outbursts are over, the disc around the NS contains enough matter for the source to enter the cold-disc phase. In this respect, GX 304–1 is a very interesting source because after June 2016, the system did no longer exhibit any outbursts. One would expect that if the accretion disc around the NS is not being fed with matter in the absence of outbursts, the cold disc would slowly empty since all the matter would eventually be accreted onto the NS. Therefore, in this scenario, one would expect that the luminosity would slowly decrease during this phase (until all the matter in the cold disc is consumed and other emission mechanisms might take over; see also the discussion in Tsygankov et al. 2017b).
To test this hypothesis, we set up an XRT campaign to investigate the long-term behaviour of GX 304–1 after it was clear that the source no longer exhibited any outbursts. We found that the luminosity had decreased by a factor of 2–3 compared to that observed in the cold-disc phase between type I outbursts. However, we did not observe an overall decay trend, as we expected. Instead, the source has now been in a quasi-stable state for over one year, in which its count rate only varies by a factor of 2–3. This variability does not seem to be correlated with periastron passages because similar variability is also observed at other orbital phases (i.e at apastron). The reasons for this quasi-stable state and the observed variability are unclear. It might be that during periastron passages the cold disc continues to be replenished, either because matter is transferred from the decretion disc or through the wind of the Be star. In any case, it remains unclear why this additional matter does not cause a full type I outburst or at least noticeable increases in luminosity at periastron. We continue our monitoring campaign to further study this enigmatic state in GX 304–1.
Although the luminosities observed for GX 304–1 and GRO J1008–57 during the cold-disc state are of such high level that only accretion down to the inner regions could cause the emission, it has not been proven so far that matter indeed reached their NSs. Accretion down to the surface would be demonstrated if pulsations were detected, and Tsygankov et al. (2017b) predicted that such phenomenon should be observed. Our detection of X-ray pulsations at the spin period of GX 304–1 during our NuSTAR observation at the quasi-stable state of the source (performed at apastron and, by coincidence, at one of the lowest observed luminosity), confirms the fact that, indeed, matter is still accreted all the way down to the surface. Since this quasi-stable state is, most likely, just an extension of the cold-disc phase, we now have strong evidence that matter is accreted down to the surface when these systems are in the cold-disc phase.
Our observed period is consistent with the period expected from the general spin-down trend that the source seems to follow, which started at the end of the strong type I outburst activity in 2012 and continued to the present day (see the Fermi/GBM data as linked in footnote2; see Postnov et al. 2015 and Sugizaki et al. 2015 for the spin evolution until 2013). The strength of the pulsations (∼20%) and the pulse profile are similar to those observed during outbursts (Devasia et al. 2011; Malacaria et al. 2015; Jaisawal et al. 2016). However, the pulse profiles vary strongly during and between outbursts, and with energy. It is therefore unclear whether the observed similarities between outburst and the quasi-stable state are due to the same underlying (inner) accretion geometry or are purely due to chance. The fact that the source is currently in a quasi-stable state allows for additional observations to study the pulsations in more detail and to better understand accretion through a cold disc. In addition, pulsations are also expected in the cold-disc phase of other slowly rotating Be/X-ray transients (i.e. in GRO J1008–57), therefore these systems are perfect targets to study this stage further.
The source is known with source identifier 863533199843070208 in the second Gaia Data Release (Gaia Collaboration 2018). From this we estimated the distance following Bailer-Jones et al. (2018).
See https://gammaray.nsstc.nasa.gov/gbm/science/pulsars/lightcurves/gx304m1.html for the most recently observed spin period of the source (using the Fermi Gamma-ray Burst monitor).
Acknowledgments
ARE and RW acknowledge support from an NWO Top grant, module 1, awarded to RW. JvdE is supported by NWO. The authors thank Fiona Harrison and the NuSTAR team for rapidly approving and executing our observation. We also thank the Swift team (and Neil Gehrels and Brad Cenko) for granting and scheduling our (many) XRT observations.
References
- Bailer-Jones, C. A. L., Rybizki, J., Fouesneau, M., Mantelet, G., & Andrae, R. 2018, AJ, 156, 58 [NASA ADS] [CrossRef] [Google Scholar]
- Brumback, M. C., Hickox, R. C., Fürst, F. S., et al. 2018a, ApJ, 852, 132 [NASA ADS] [CrossRef] [Google Scholar]
- Brumback, M. C., Hickox, R. C., Bachetti, M., et al. 2018b, ApJ, 861, L7 [NASA ADS] [CrossRef] [Google Scholar]
- D’Angelo, C. R., & Spruit, H. C. 2010, MNRAS, 406, 1208 [NASA ADS] [Google Scholar]
- Devasia, J., James, M., Paul, B., & Indulekha, K. 2011, MNRAS, 417, 348 [NASA ADS] [CrossRef] [Google Scholar]
- Doroshenko, V., Santangelo, A., Doroshenko, R., et al. 2014, A&A, 561, A96 [NASA ADS] [CrossRef] [EDP Sciences] [Google Scholar]
- Ducci, L., Romano, P., Malacaria, C., et al. 2018, A&A, 614, A34 [NASA ADS] [CrossRef] [EDP Sciences] [Google Scholar]
- Evans, P. A., Beardmore, A. P., Page, K. L., et al. 2009, MNRAS, 397, 1177 [NASA ADS] [CrossRef] [Google Scholar]
- Gaia Collaboration (Brown, A. G. A., et al.) 2018, A&A, 616, A1 [NASA ADS] [CrossRef] [EDP Sciences] [Google Scholar]
- Haberl, F., & Sturm, R. 2016, A&A, 586, A81 [NASA ADS] [CrossRef] [EDP Sciences] [Google Scholar]
- Harrison, F. A., Craig, W. W., Christensen, F. E., et al. 2013, ApJ, 770, 103 [NASA ADS] [CrossRef] [Google Scholar]
- Illarionov, A. F., & Sunyaev, R. A. 1975, A&A, 39, 185 [NASA ADS] [Google Scholar]
- Jaisawal, G. K., Naik, S., & Epili, P. 2016, MNRAS, 457, 2749 [NASA ADS] [CrossRef] [Google Scholar]
- Krimm, H. A., Holland, S. T., Corbet, R. H. D., et al. 2013, ApJS, 209, 14 [NASA ADS] [CrossRef] [Google Scholar]
- Laplace, E., Mihara, T., Moritani, Y., et al. 2017, A&A, 597, A124 [NASA ADS] [CrossRef] [EDP Sciences] [Google Scholar]
- Leahy, D. A., Darbro, W., Elsner, R. F., et al. 1983, ApJ, 266, 160 [NASA ADS] [CrossRef] [Google Scholar]
- Malacaria, C., Klochkov, D., Santangelo, A., & Staubert, R. 2015, A&A, 581, A121 [NASA ADS] [CrossRef] [EDP Sciences] [Google Scholar]
- Malacaria, C., Kollatschny, W., Whelan, E., et al. 2017, A&A, 603, A24 [NASA ADS] [CrossRef] [EDP Sciences] [Google Scholar]
- Manousakis, A., Beckmann, V., Bianchin, V., et al. 2008, ATel, 1613 [Google Scholar]
- Martin, R. G., Nixon, C., Armitage, P. J., Lubow, S. H., & Price, D. J. 2014, ApJ, 790, L34 [NASA ADS] [CrossRef] [Google Scholar]
- McClintock, J. E., Rappaport, S. A., Nugent, J. J., & Li, F. K. 1977, ApJ, 216, L15 [NASA ADS] [CrossRef] [Google Scholar]
- Monageng, I. M., McBride, V. A., Coe, M. J., Steele, I. A., & Reig, P. 2017, MNRAS, 464, 572 [NASA ADS] [CrossRef] [Google Scholar]
- Moritani, Y., Nogami, D., Okazaki, A. T., et al. 2013, PASJ, 65, 83 [NASA ADS] [Google Scholar]
- Mukherjee, U., & Paul, B. 2005, A&A, 431, 667 [NASA ADS] [CrossRef] [EDP Sciences] [Google Scholar]
- Nakajima, M., Tanaka, K., Mihara, T., et al. 2016, ATel, 9064 [Google Scholar]
- Orlandini, M., Bartolini, C., Campana, S., et al. 2004, Nucl. Phys. B Proc. Suppl., 132, 476 [NASA ADS] [CrossRef] [Google Scholar]
- Pietsch, W., Oegelman, H., Kahabka, P., Collmar, W., & Gottwald, M. 1986, A&A, 163, 93 [NASA ADS] [Google Scholar]
- Postnov, K. A., Mironov, A. I., Lutovinov, A. A., et al. 2015, MNRAS, 446, 1013 [NASA ADS] [CrossRef] [Google Scholar]
- Priedhorsky, W. C., & Terrell, J. 1983, ApJ, 273, 709 [NASA ADS] [CrossRef] [Google Scholar]
- Reig, P. 2011, Ap&SS, 332, 1 [NASA ADS] [CrossRef] [Google Scholar]
- Reig, P., & Zezas, A. 2018, A&A, 613, A52 [NASA ADS] [CrossRef] [EDP Sciences] [Google Scholar]
- Romanova, M. M., Ustyugova, G. V., Koldoba, A. V., & Lovelace, R. V. E. 2004, ApJ, 616, L151 [NASA ADS] [CrossRef] [Google Scholar]
- Rothschild, R., Markowitz, A., Hemphill, P., et al. 2013, ApJ, 770, 19 [NASA ADS] [CrossRef] [Google Scholar]
- Rothschild, R. E., Kühnel, M., Pottschmidt, K., et al. 2017, MNRAS, 466, 2752 [NASA ADS] [CrossRef] [Google Scholar]
- Rouco Escorial, A., & Wijnands, R. 2016, ATel, 9101 [Google Scholar]
- Rouco Escorial, A., Bak Nielsen, A. S., Wijnands, R., et al. 2017, MNRAS, 472, 1802 [NASA ADS] [CrossRef] [Google Scholar]
- Sguera, V., & Sidoli, L. 2016, ATel, 9067 [Google Scholar]
- Stollberg, M. T., Finger, M. H., Wilson, R. B., et al. 1993, IAU Circ., 5836 [Google Scholar]
- Sugizaki, M., Yamamoto, T., Mihara, T., Nakajima, M., & Makishima, K. 2015, PASJ, 67, 73 [NASA ADS] [Google Scholar]
- Tsygankov, S. S., Mushtukov, A. A., Suleimanov, V. F., et al. 2017a, A&A, 608, A17 [NASA ADS] [CrossRef] [EDP Sciences] [Google Scholar]
- Tsygankov, S. S., Wijnands, R., Lutovinov, A. A., Degenaar, N., & Poutanen, J. 2017b, MNRAS, 470, 126 [NASA ADS] [CrossRef] [Google Scholar]
- Tsygankov, S. S., Rouco Escorial, A., Suleimanov, V., et al. 2018, MNRAS, submitted [arXiv:1810.13307] [Google Scholar]
- Wijnands, R., & Degenaar, N. 2016, MNRAS, 463, L46 [NASA ADS] [CrossRef] [Google Scholar]
- Wijnands, R., Degenaar, N., & Page, D. 2017, JApA, 38, 49 [Google Scholar]
- Yamamoto, T., Sugizaki, M., Mihara, T., et al. 2011, PASJ, 63, S751 [NASA ADS] [CrossRef] [Google Scholar]
All Figures
|
Fig. 1. BAT (15–50 keV; black circles) and XRT (0.5–10 keV; blue squares) light curves of GX 304–1 from January 1, 2012, to October 30, 2018. The time of our NuSTAR observation is indicated with the yellow lines. The three insets show the behaviour of the source during different states (see main text for details). Vertical lines correspond to periastron passages (determined using the ephemeris of Sugizaki et al. 2015). |
| In the text | |
|
Fig. 2. NuSTAR combined FPMA and FPMB light curve (3–30 keV) folded on the best-fitting period of P = 275.12 s. The count rate has been normalised by dividing it by the mean count rate of 0.313 count s−1 (indicated by the red dashed line). The green dotted line shows the best-fitting model, which consists of a fundamental and one harmonic at twice the frequency. |
| In the text | |
Current usage metrics show cumulative count of Article Views (full-text article views including HTML views, PDF and ePub downloads, according to the available data) and Abstracts Views on Vision4Press platform.
Data correspond to usage on the plateform after 2015. The current usage metrics is available 48-96 hours after online publication and is updated daily on week days.
Initial download of the metrics may take a while.