Fig. 2.
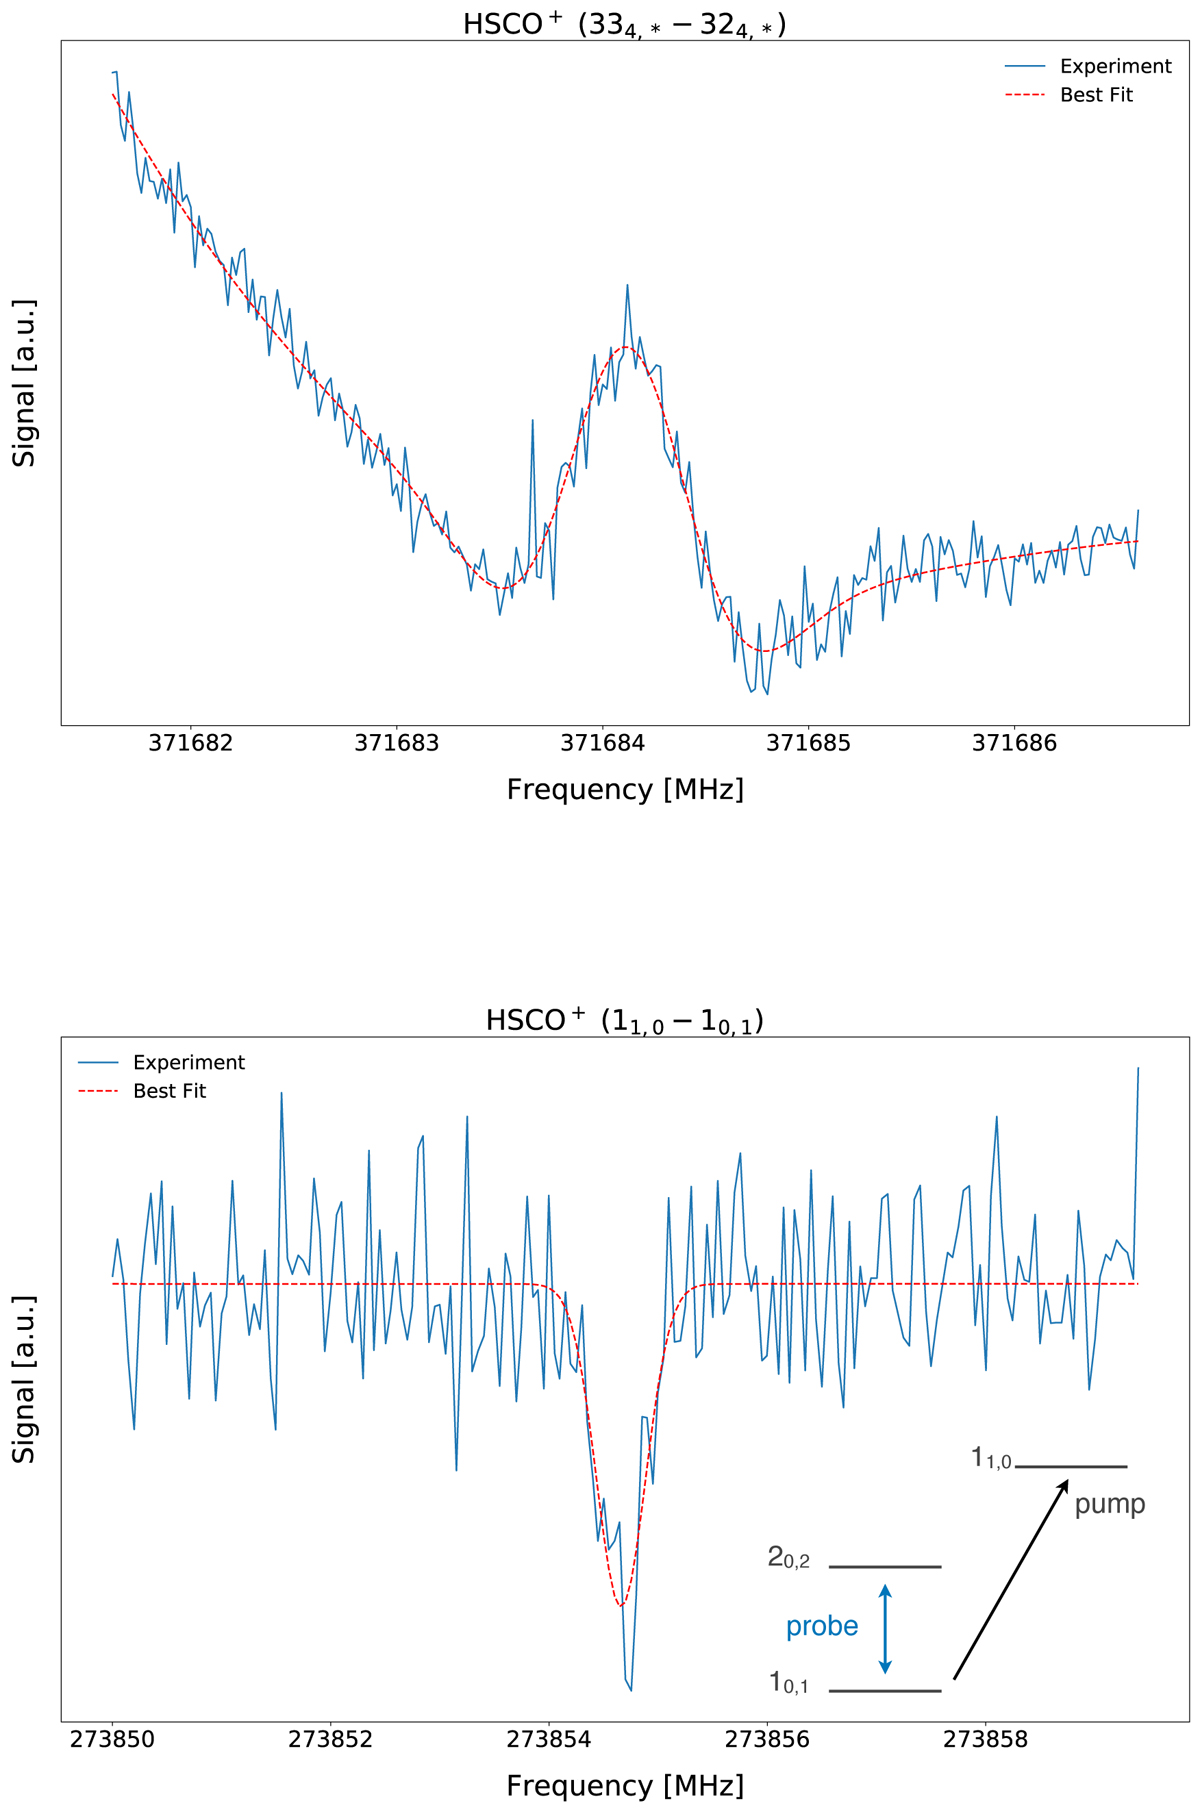
Laboratory spectra of HSCO+: the JKa, Kc = 334, * − 304, * (overlapping) doublet around 371 GHz, acquired in 725 s integration time with 3 ms time constant; the strong spikes visible in the plot are due to instabilities of the DC discharge (top panel). The b-type JKa, Kc = 11, 0 − 10, 1 rotational transition around 274 GHz, acquired in double resonance with a 45 kHz step, and in a total integration time of 20 min (30 shots per integration step at 5 Hz) (bottom panel). The red dashed lines represent the best fit to a speed-dependent Voigt (top) and Gaussian profile (bottom). A schematic diagram indicating the two transitions that share a common energy level is shown in the inset.
Current usage metrics show cumulative count of Article Views (full-text article views including HTML views, PDF and ePub downloads, according to the available data) and Abstracts Views on Vision4Press platform.
Data correspond to usage on the plateform after 2015. The current usage metrics is available 48-96 hours after online publication and is updated daily on week days.
Initial download of the metrics may take a while.