Fig. 4.
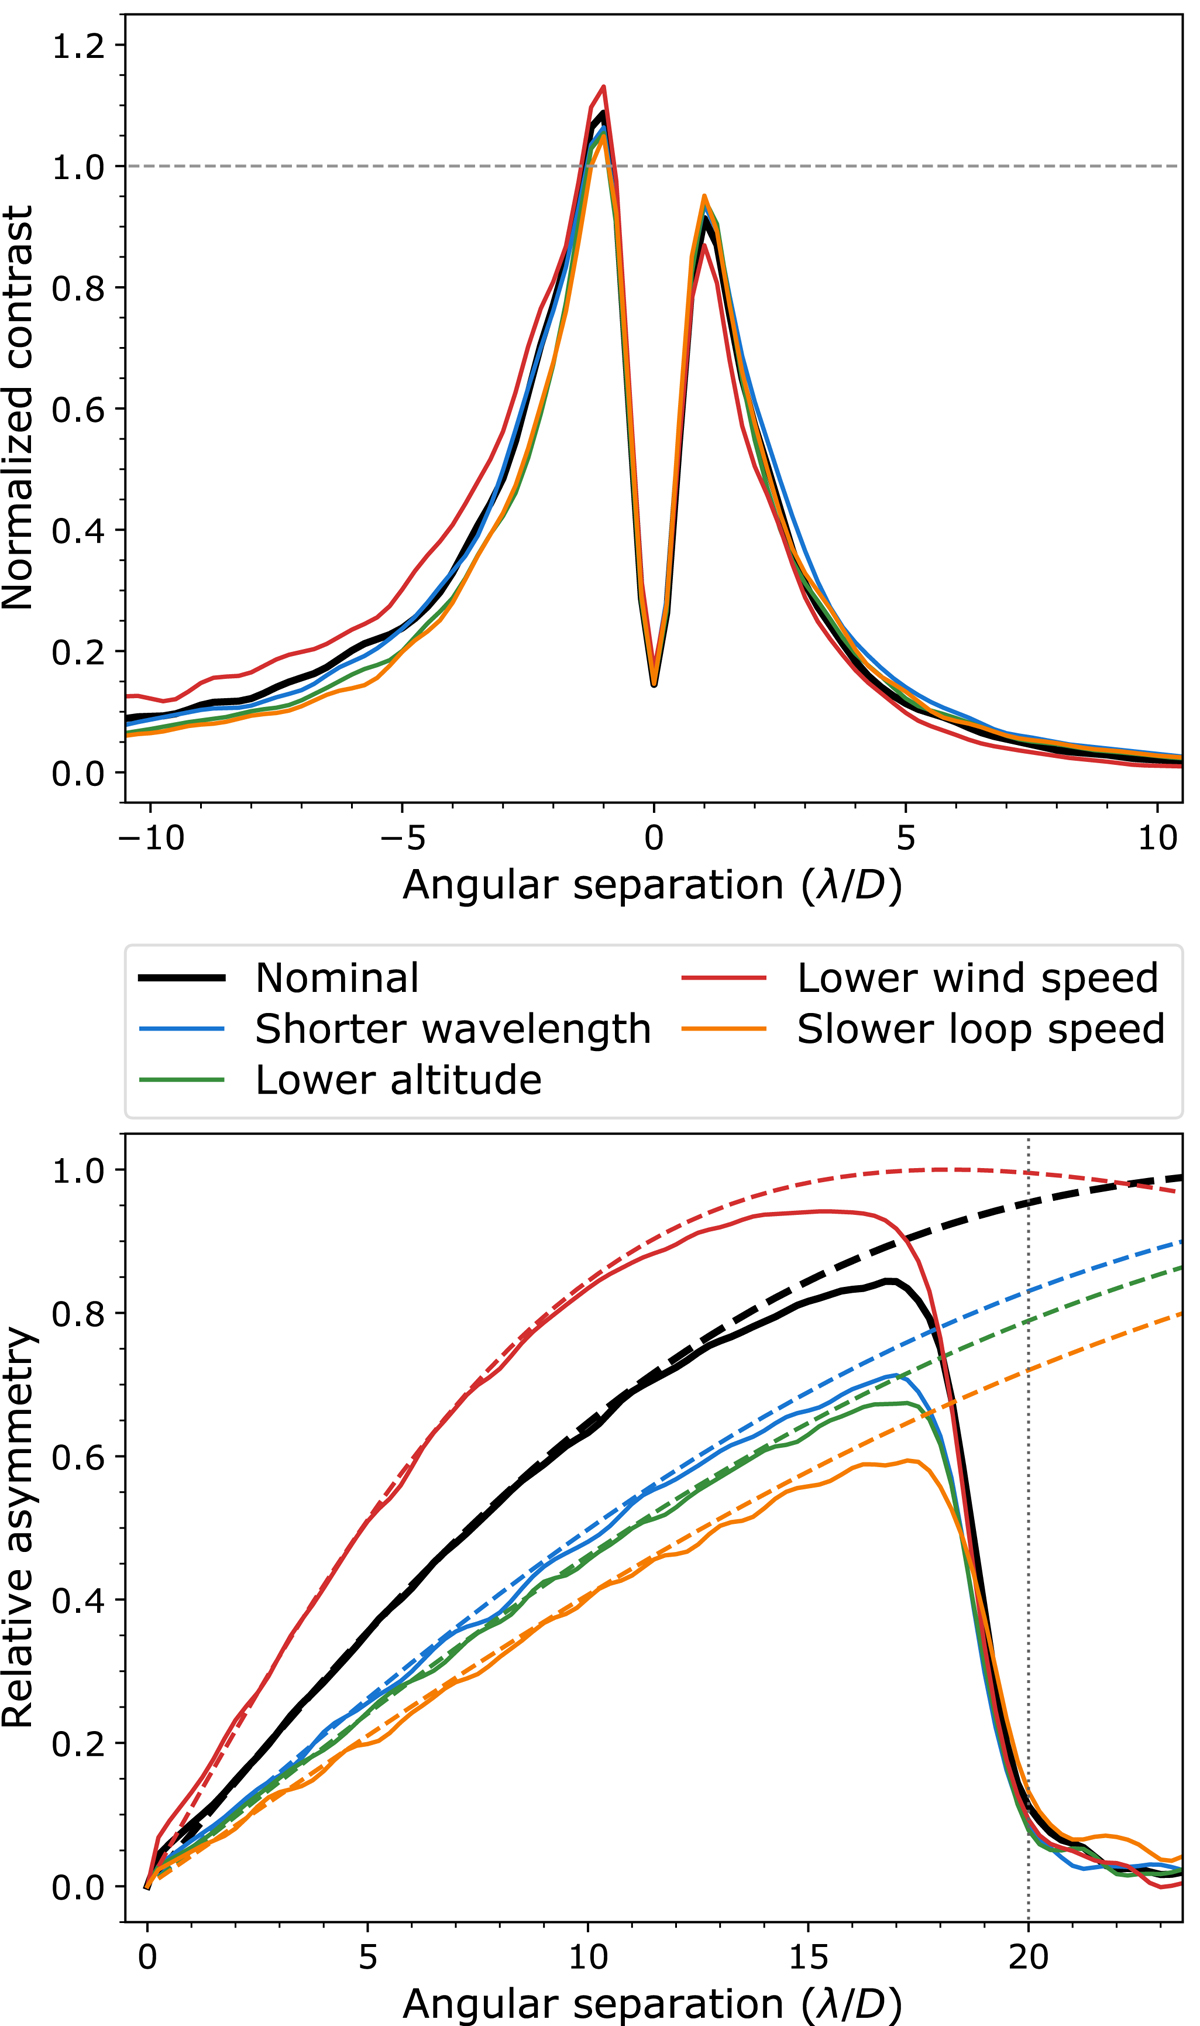
Radial profiles along the wind direction (top panel) and asymmetry factor as defined in Eq. (12) (bottom panel) for the simulated data sets. The solid black line uses the nominal parameters from Table 1 (image shown in the bottom right of Fig. 3). Other lines differ in one parameter playing a role in the asymmetry: shorter wavelength (H-band, λ = 1.6 μm, blue line), lower altitude (z = 8 km, green line), lower wind speed (vwind = 20 m s−1, red line), and slower AO loop frequency (fAO = 800 Hz, yellow line). The DM cutoff frequency is at 20λ/D (dotted grey line). In the bottom plot, solid lines indicate the asymmetry from the simulated images and dashed lines show the prediction from Eq. (14).
Current usage metrics show cumulative count of Article Views (full-text article views including HTML views, PDF and ePub downloads, according to the available data) and Abstracts Views on Vision4Press platform.
Data correspond to usage on the plateform after 2015. The current usage metrics is available 48-96 hours after online publication and is updated daily on week days.
Initial download of the metrics may take a while.