Fig. 7.
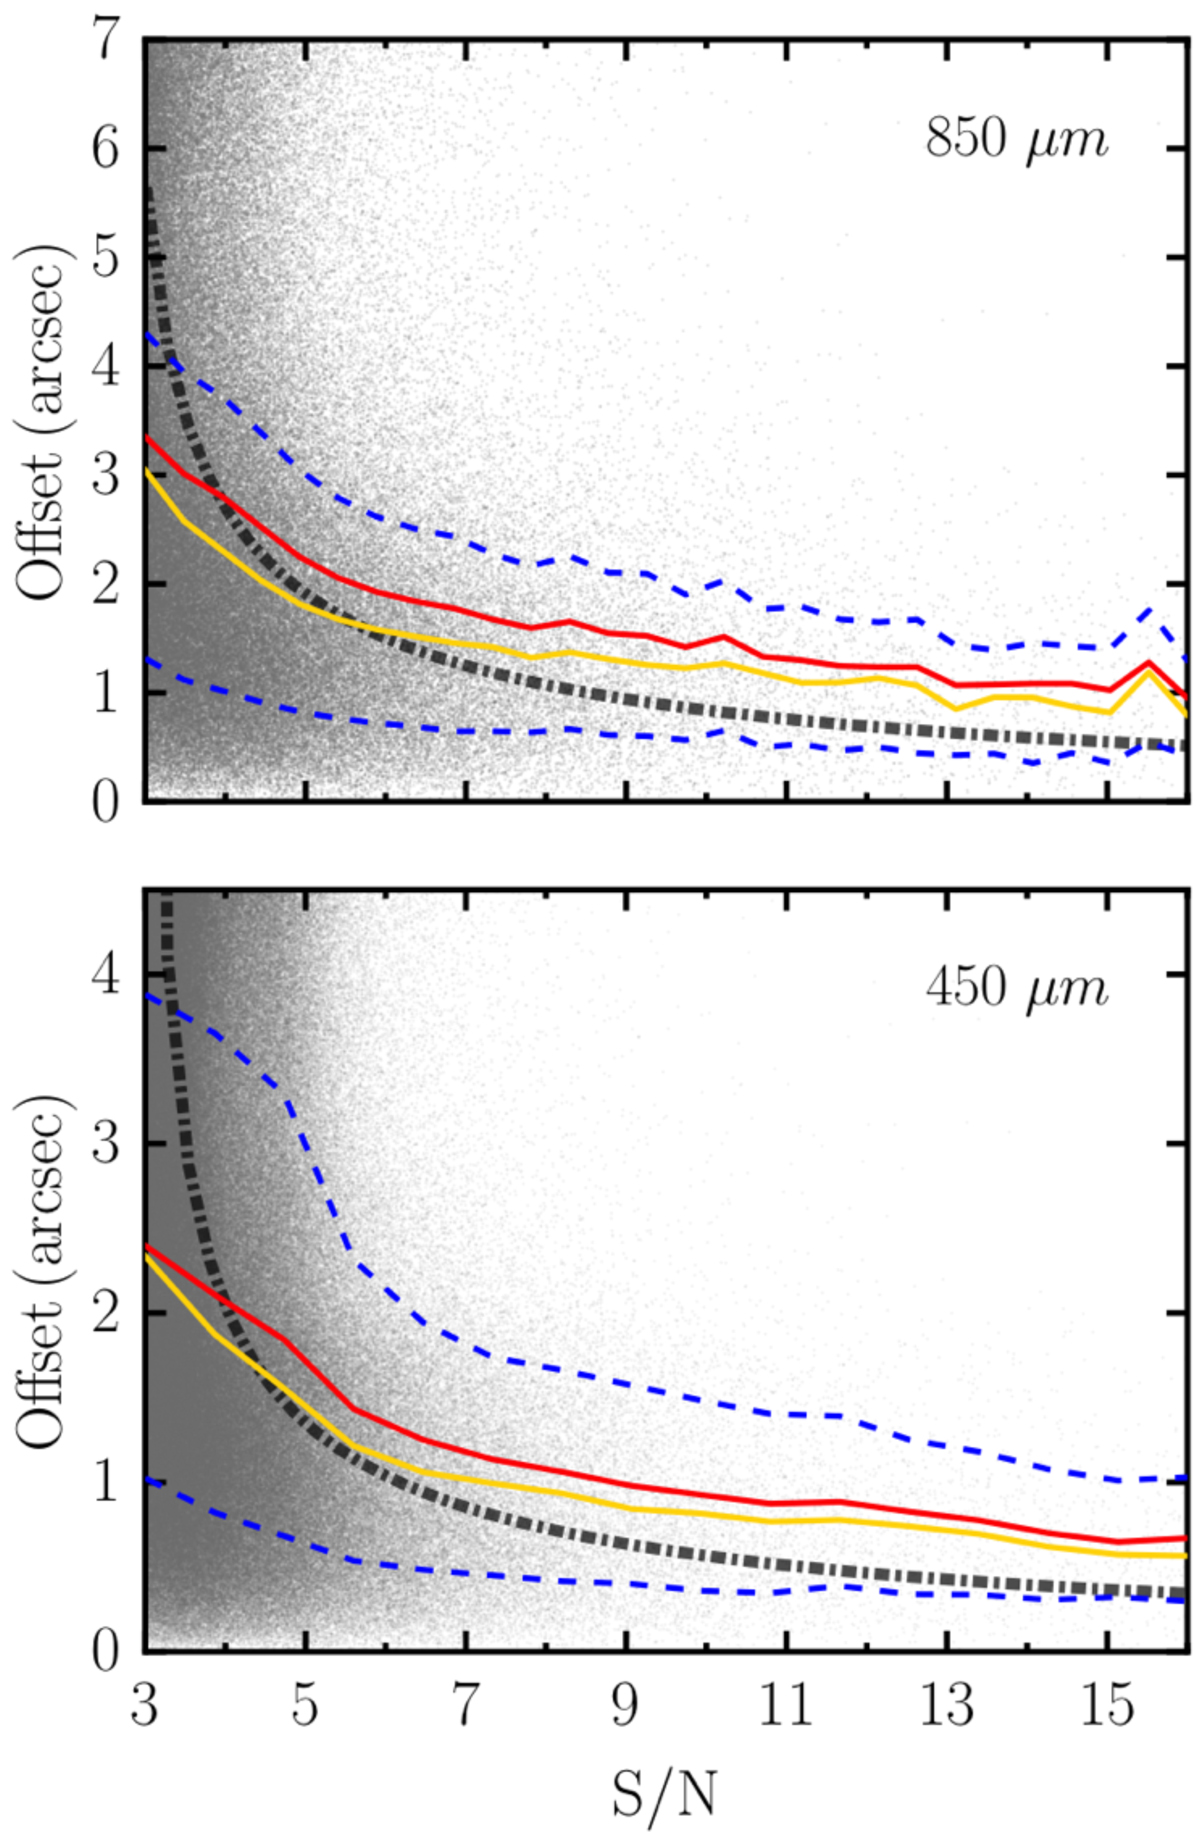
Positional offset between the detected sources and the injected sources from the 500 realizations of the estimated underlying counts models (Sect. 4) as a function of the S/N of the detections. The gray dots are ∼100 000 simulated data-points. We show the mean (red) and median (yellow) values of the positional offsets in different S/N bins. The blue dashed curves enclose the 1σ range relative to the mean curve. The test is shown for both 850 (top) and 450 μm (bottom). The dot-dashed black lines indicate the predictions from Ivison et al. (2007) based on the LESS sample.
Current usage metrics show cumulative count of Article Views (full-text article views including HTML views, PDF and ePub downloads, according to the available data) and Abstracts Views on Vision4Press platform.
Data correspond to usage on the plateform after 2015. The current usage metrics is available 48-96 hours after online publication and is updated daily on week days.
Initial download of the metrics may take a while.