Fig. 5.
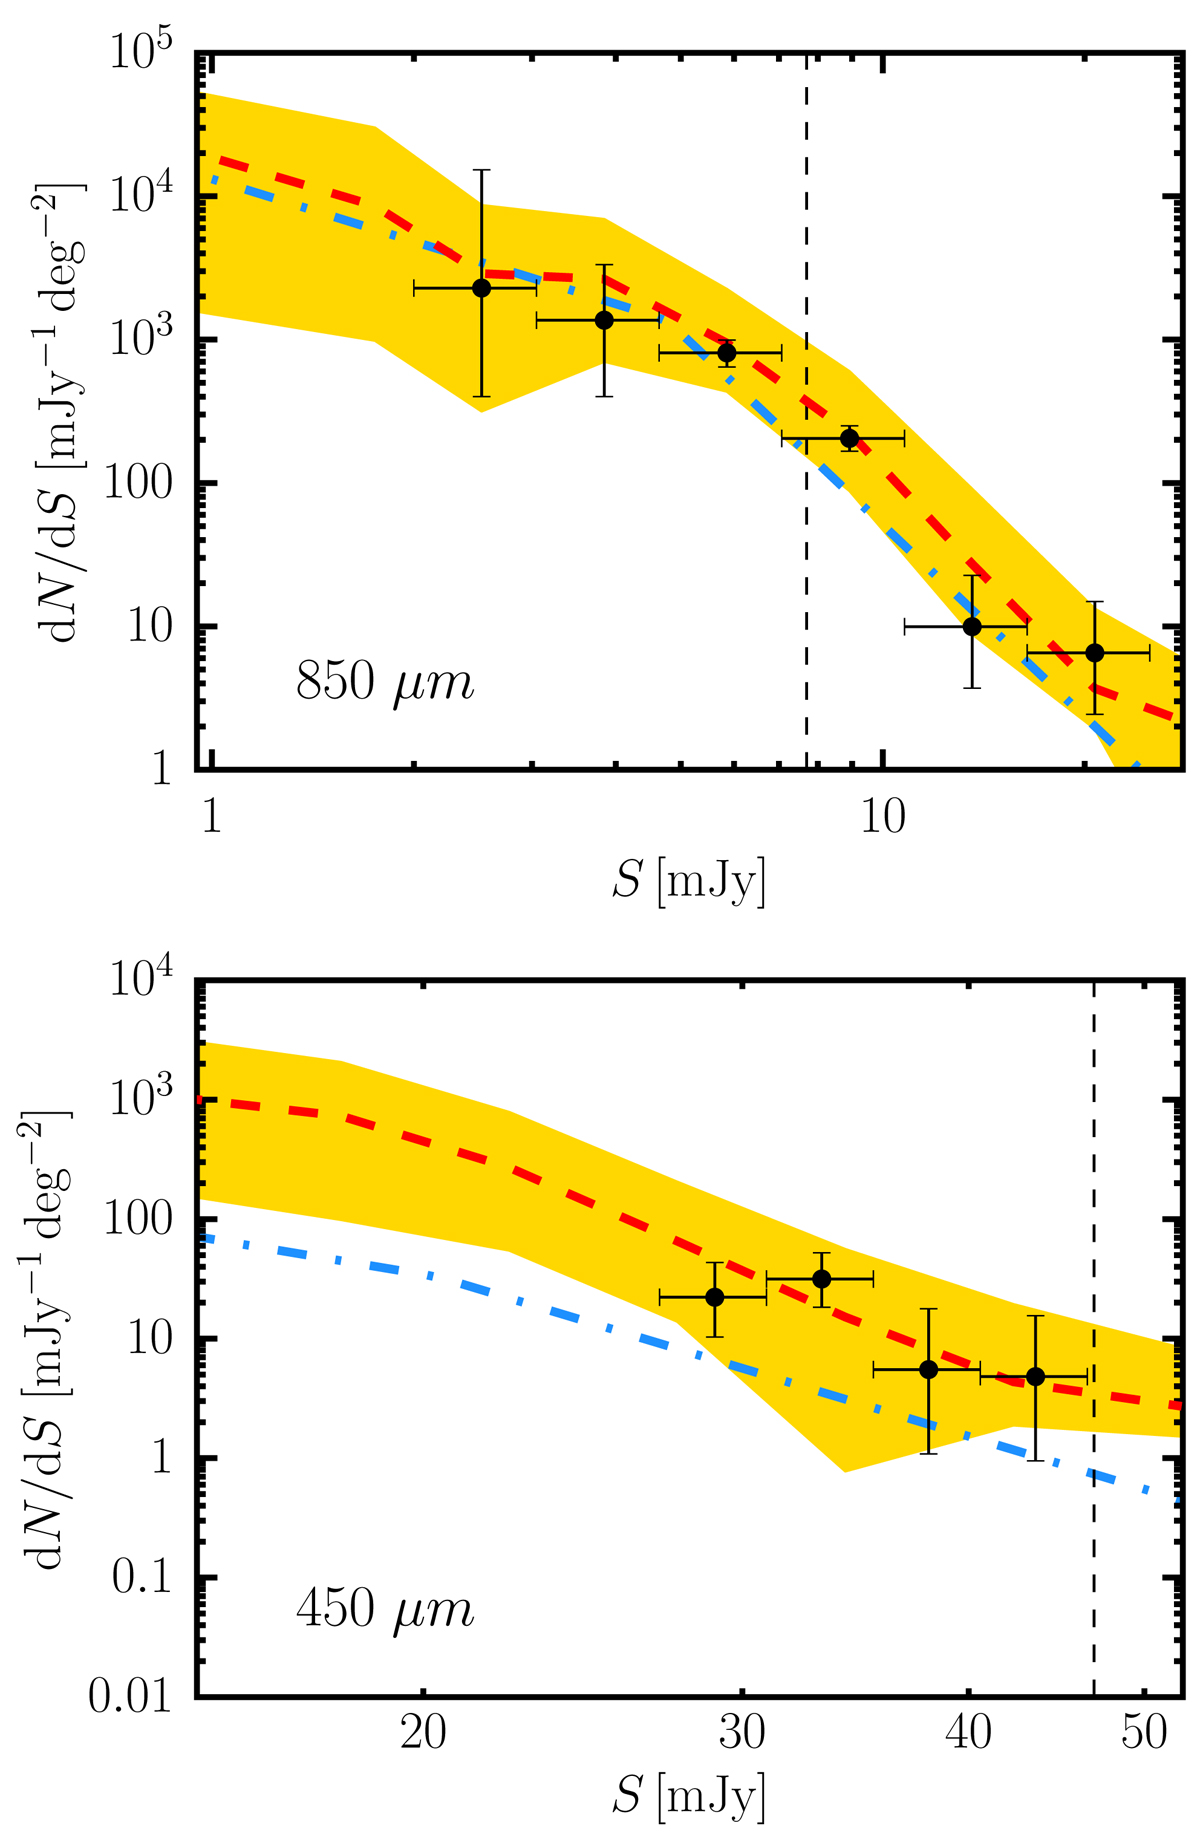
Pure source differential number counts (black data-point) at 850 and 450 μm around the ELAN MAMMOTH-1 compared to the simulated mean counts (red dashed line). The yellow shadings represent the 90% confidence range obtained from 500 realizations of the blue dot-dashed curves. The blue dot-dashed curves are the final adopted underlying models for the Monte Carlo simulations (see Sect. 4), and represent the true number counts. The dashed vertical lines indicate the mean 4σ within the effective area. The horizontal errorbars for the data-points indicate the width of each flux bin.
Current usage metrics show cumulative count of Article Views (full-text article views including HTML views, PDF and ePub downloads, according to the available data) and Abstracts Views on Vision4Press platform.
Data correspond to usage on the plateform after 2015. The current usage metrics is available 48-96 hours after online publication and is updated daily on week days.
Initial download of the metrics may take a while.