Fig. 9
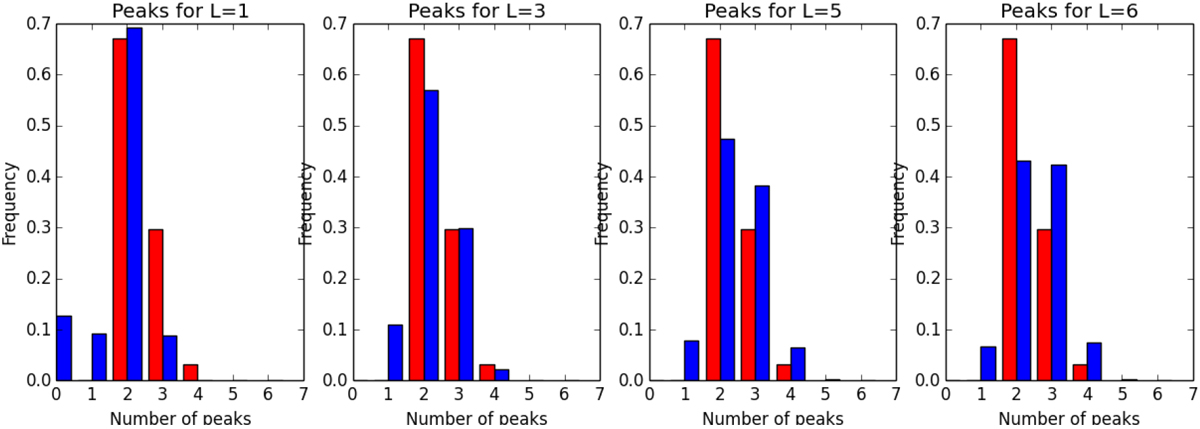
Inblue: histograms of the number of peaks in the profiles of linear polarization found from 1000 synthetic cases of stars with (from left to right) ℓmax = 1, 3, 5, and 6. In red: common to the four plots, the histograms of the number of peaks in the real dataset of Betelgeuse. The comparison of both histograms is satisfactory for ℓmax = 3–5.
Current usage metrics show cumulative count of Article Views (full-text article views including HTML views, PDF and ePub downloads, according to the available data) and Abstracts Views on Vision4Press platform.
Data correspond to usage on the plateform after 2015. The current usage metrics is available 48-96 hours after online publication and is updated daily on week days.
Initial download of the metrics may take a while.