Fig. 3
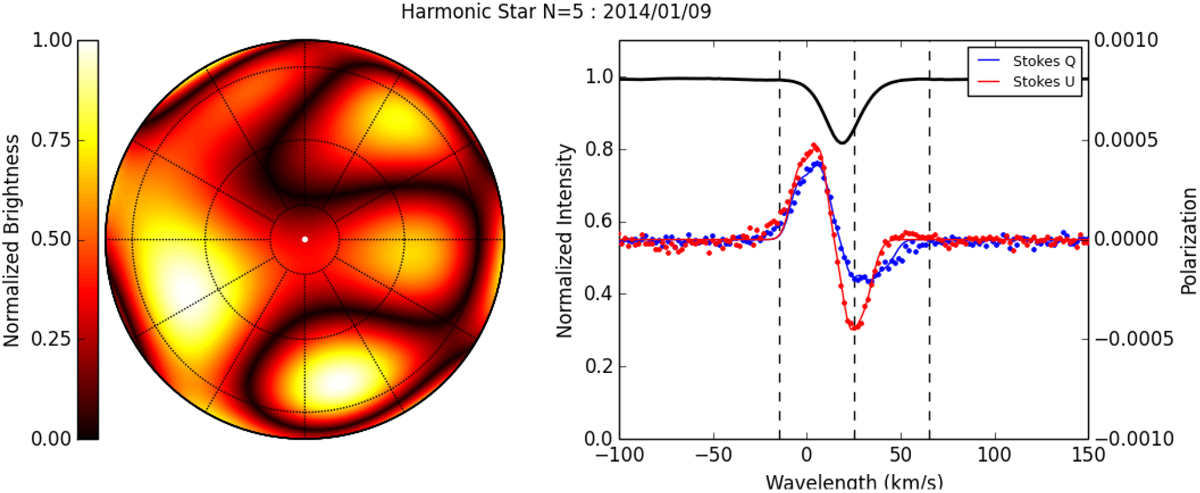
Example of inversion. The LSD profiles for Stokes Q and U, observed onJanuary 9, 2014, are shown as blue and red dots, respectively, at right. The observed intensity profile is also shown in black with ordinates at left. The inversion gave as solution the star shown at left which produces the profiles shown as continuous line at right. The dotted lines over the image are plotted to help identify the polar angle and distance to centre coordinate system over the visible hemisphere of the star. Over the spectra on the right, the vertical dotted lines indicate the centre of mass velocity of the star, as well as the blue- and redshifted extreme velocities considered by the model.
Current usage metrics show cumulative count of Article Views (full-text article views including HTML views, PDF and ePub downloads, according to the available data) and Abstracts Views on Vision4Press platform.
Data correspond to usage on the plateform after 2015. The current usage metrics is available 48-96 hours after online publication and is updated daily on week days.
Initial download of the metrics may take a while.