Fig. 2
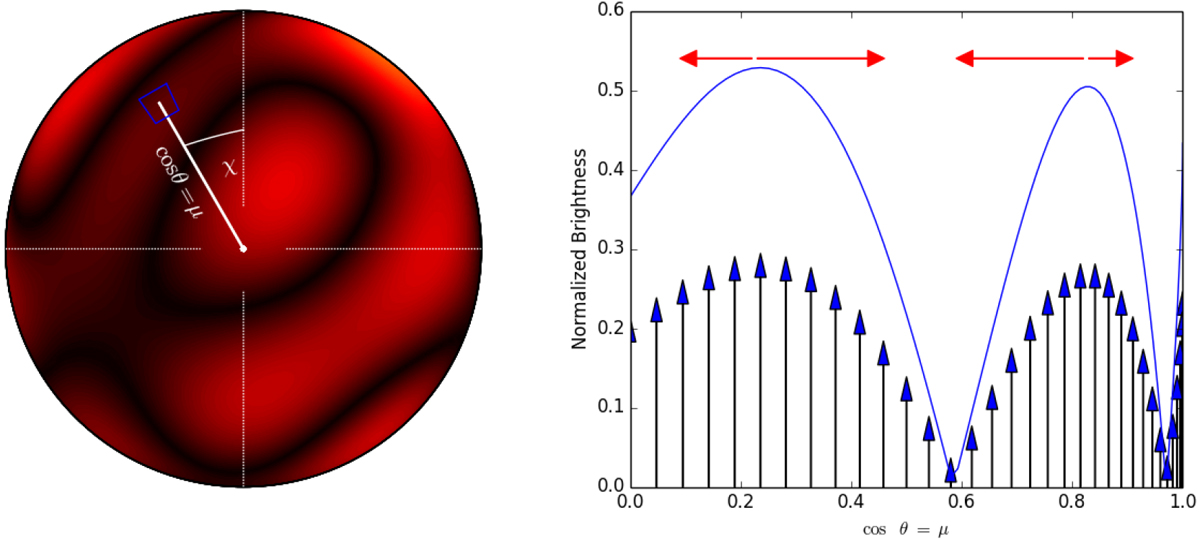
Random combination of spherical harmonics up to degree 5 represent the brilliance over the stellar disk. Left panel: graphical definition of the coordinates of the blue square over the disk. Right panel: brilliance of the disk along that particular radius in the left image. The vertical arrows indicate the vertical, radial, velocity included in the model to represent the emerging plasma velocity. We note that the zero velocity is shifted so that all velocities are positive. The red horizontal arrows represent the velocities of advection of the plasma towards the cold, integranular regions where it sinks down into the stellar interior. These horizontal velocities are not included in the actual model.
Current usage metrics show cumulative count of Article Views (full-text article views including HTML views, PDF and ePub downloads, according to the available data) and Abstracts Views on Vision4Press platform.
Data correspond to usage on the plateform after 2015. The current usage metrics is available 48-96 hours after online publication and is updated daily on week days.
Initial download of the metrics may take a while.