Free Access
Fig. 12
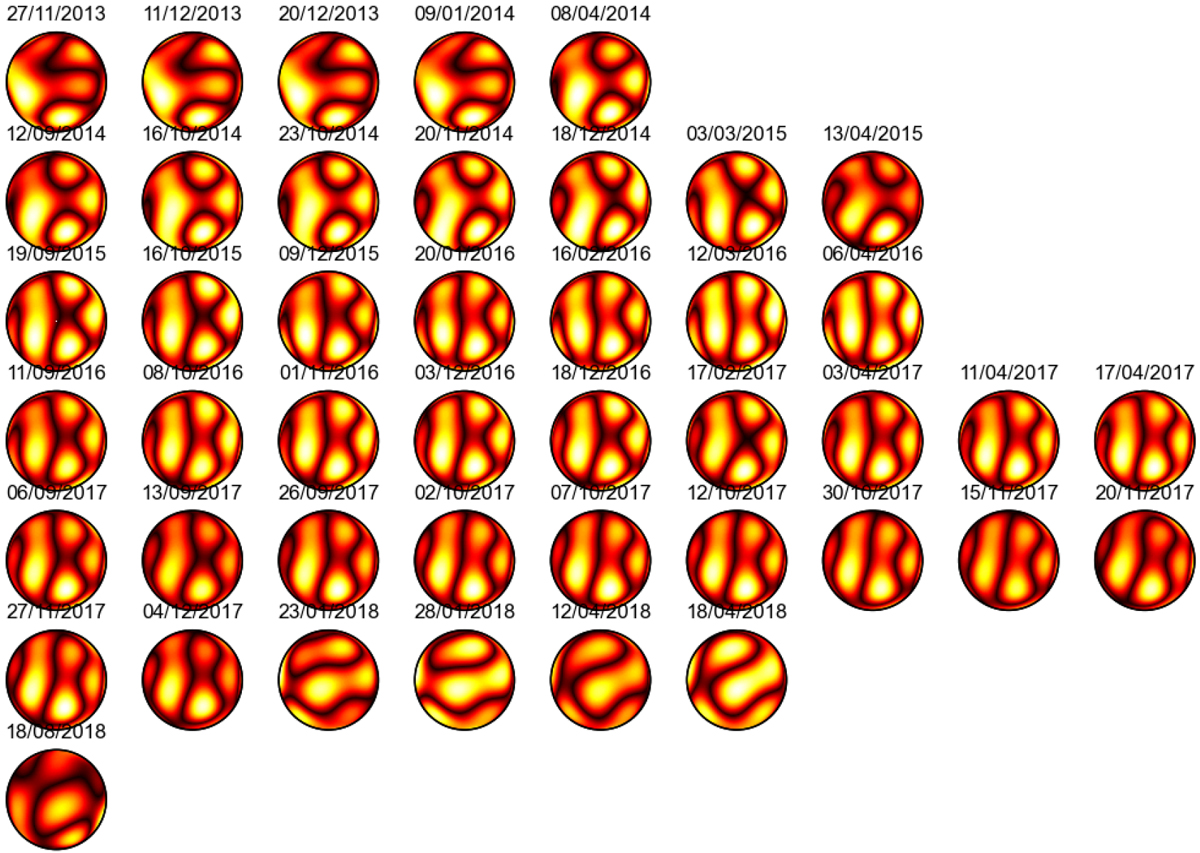
Inferred images of Betelgeuse for the full dataset from November 2013 through August 2018, using our new model with ℓmax = 5. Brilliances are normalized on each image; the colour map is the same as that used in other figures, for example, in Fig. 3.
Current usage metrics show cumulative count of Article Views (full-text article views including HTML views, PDF and ePub downloads, according to the available data) and Abstracts Views on Vision4Press platform.
Data correspond to usage on the plateform after 2015. The current usage metrics is available 48-96 hours after online publication and is updated daily on week days.
Initial download of the metrics may take a while.