Free Access
Fig. 7.
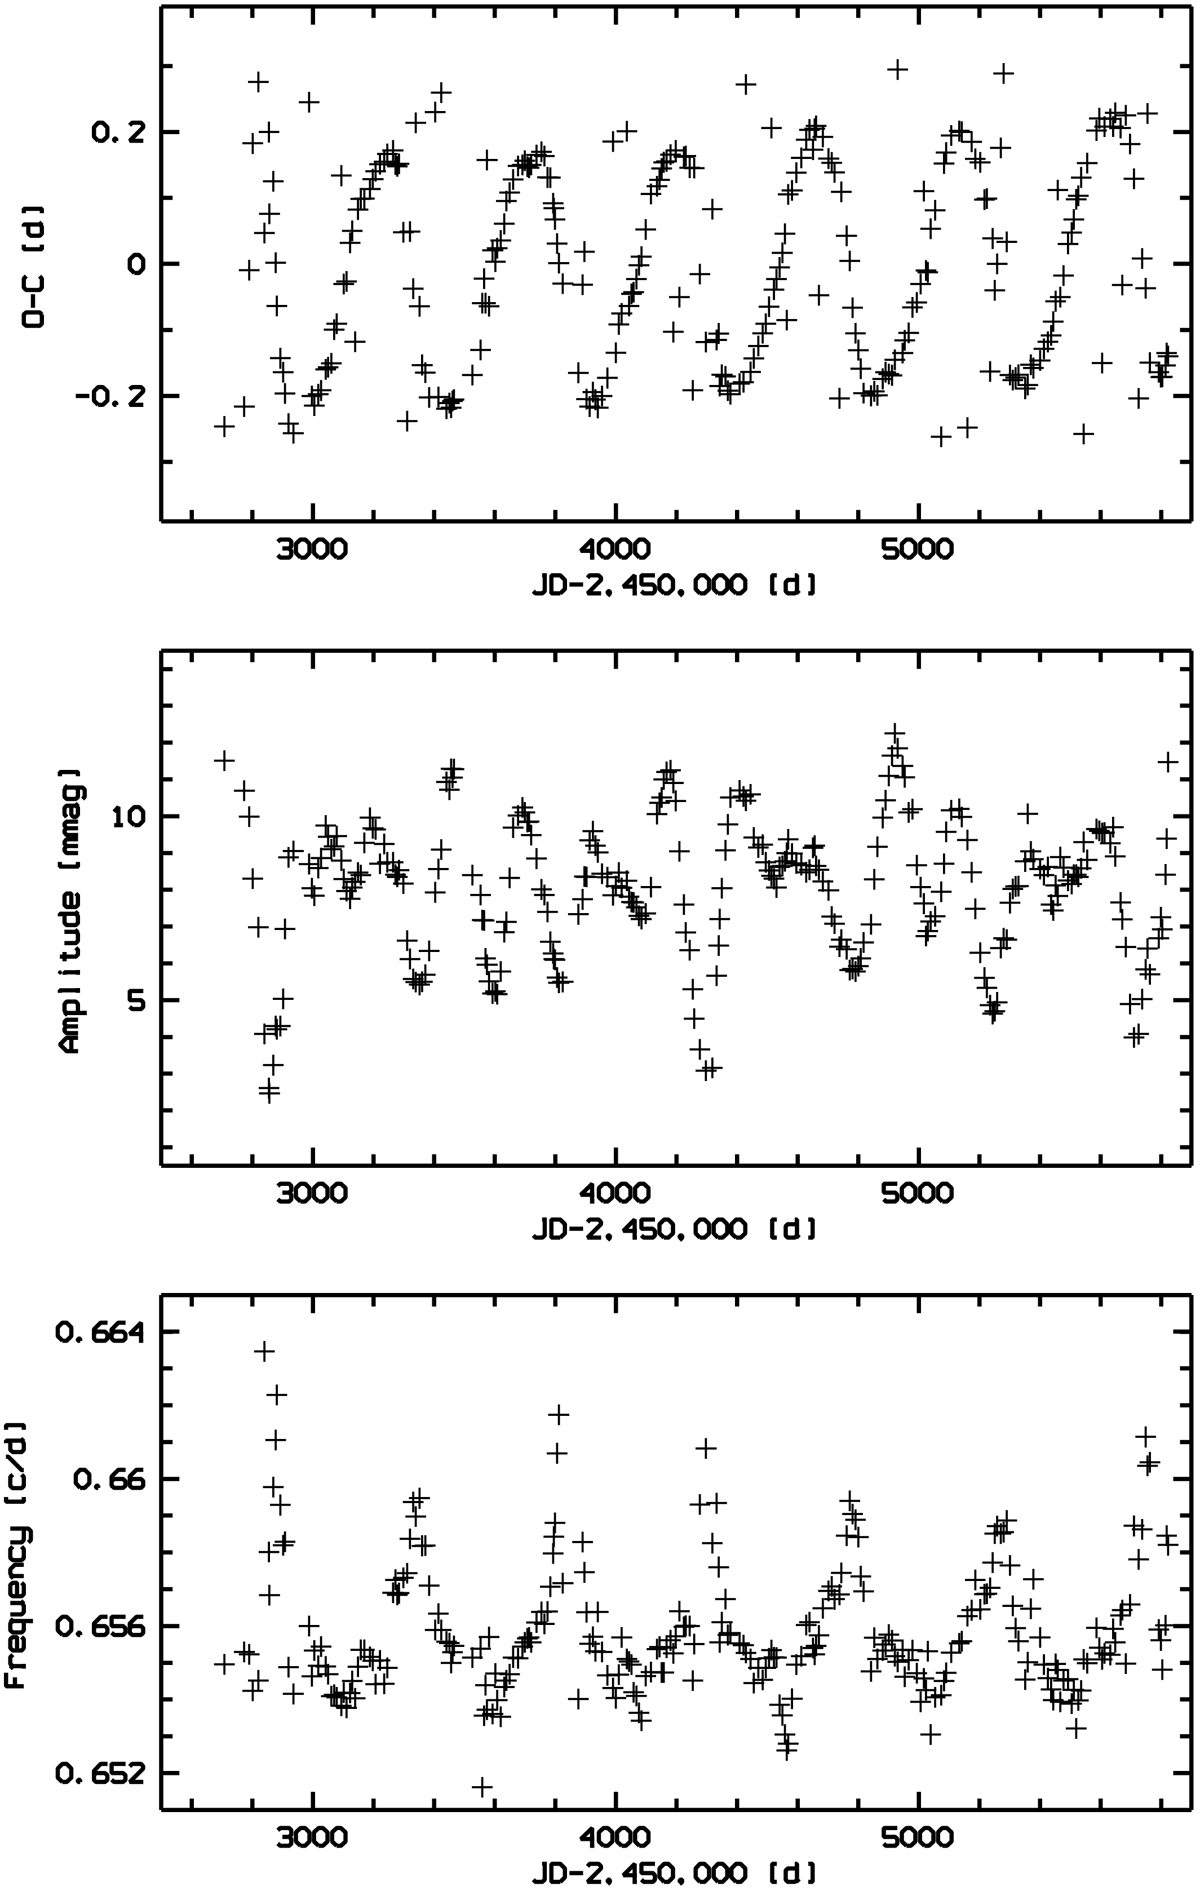
Bottom panel: frequencies of single sine functions fitted to the SMEI data of ν Pup over time intervals of 75 d stepped by 10 d. Middle panel: as bottom panel, except for amplitudes. Top panel: O–C curve for a mean frequency of 0.655802 c/d. In all three panels, outliers have been clipped.
Current usage metrics show cumulative count of Article Views (full-text article views including HTML views, PDF and ePub downloads, according to the available data) and Abstracts Views on Vision4Press platform.
Data correspond to usage on the plateform after 2015. The current usage metrics is available 48-96 hours after online publication and is updated daily on week days.
Initial download of the metrics may take a while.