Fig. 6.
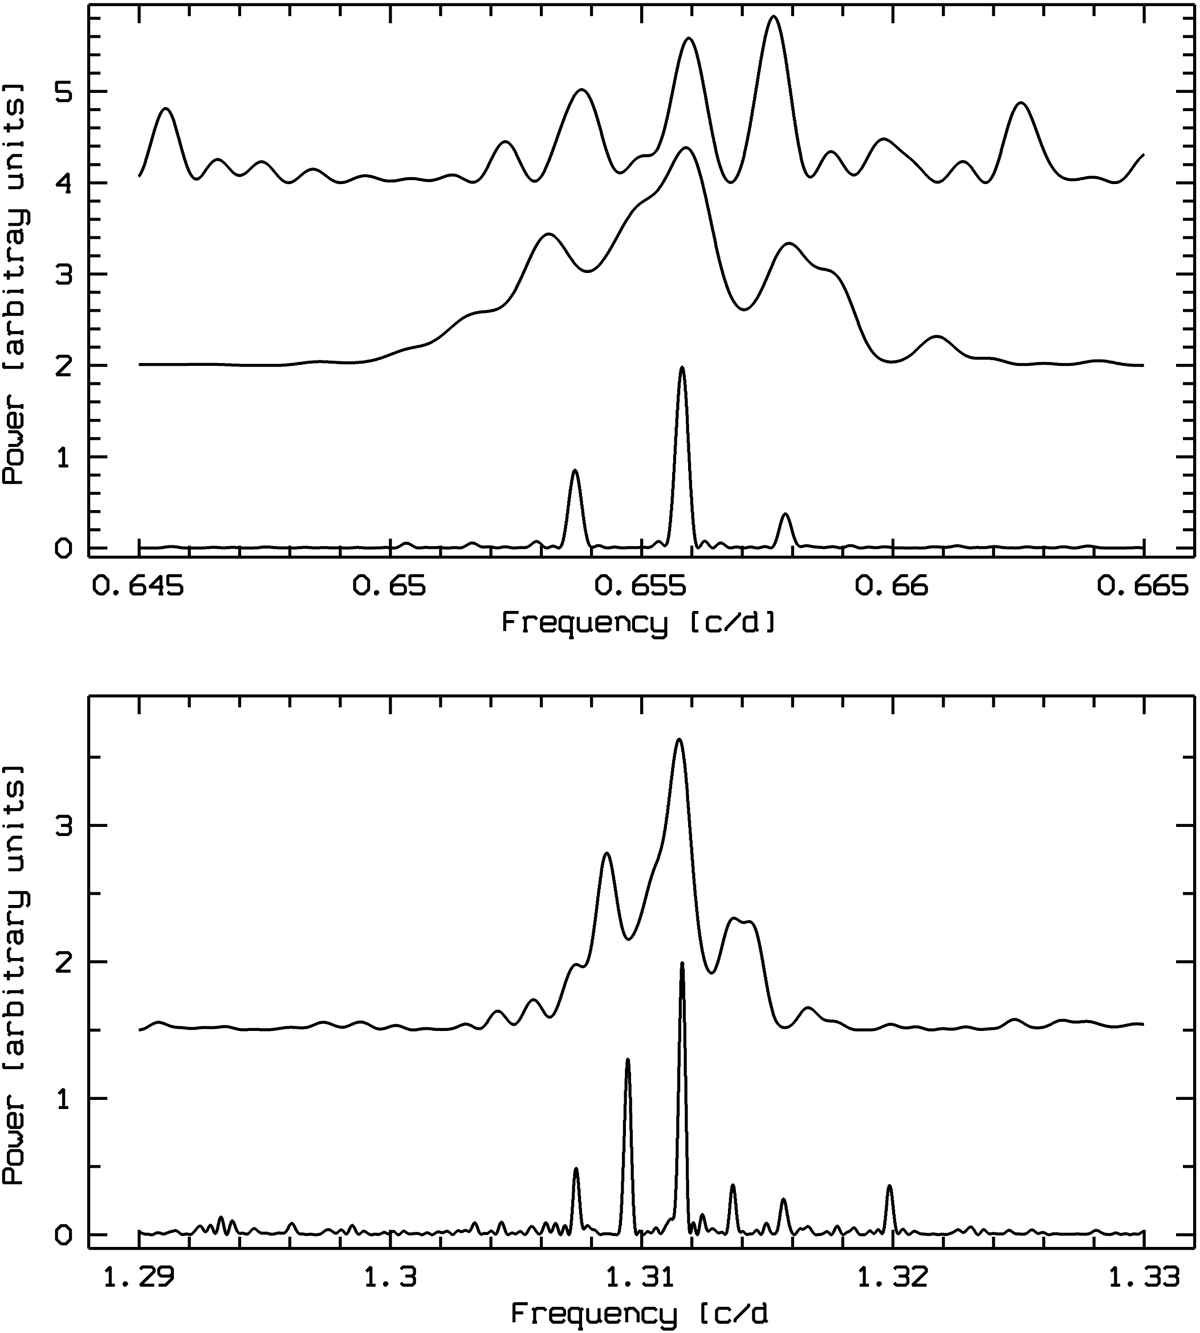
Upper panel: power spectra of HIPPARCOS (top), BRITE (middle) and SMEI (bottom, with frequencies c1–c6 (Table 5) appearing between 1.3075 and 1.32 c/d) observations. The three peaks in the SMEI power spectrum correspond with frequencies f1–f3 (Table 5). Lower panel: SMEI (bottom) and BRITE (top) power spectra of the frequency group near 1.31 c/d. The frequency range is stretched by a factor of 2 w.r.t. the upper panel so that base frequencies and harmonics line up. The power scales are arbitrary and cannot be compared between the satellites. The SMEI power scales for the two frequency groups differ by about a factor of 20.
Current usage metrics show cumulative count of Article Views (full-text article views including HTML views, PDF and ePub downloads, according to the available data) and Abstracts Views on Vision4Press platform.
Data correspond to usage on the plateform after 2015. The current usage metrics is available 48-96 hours after online publication and is updated daily on week days.
Initial download of the metrics may take a while.