Fig. 5.
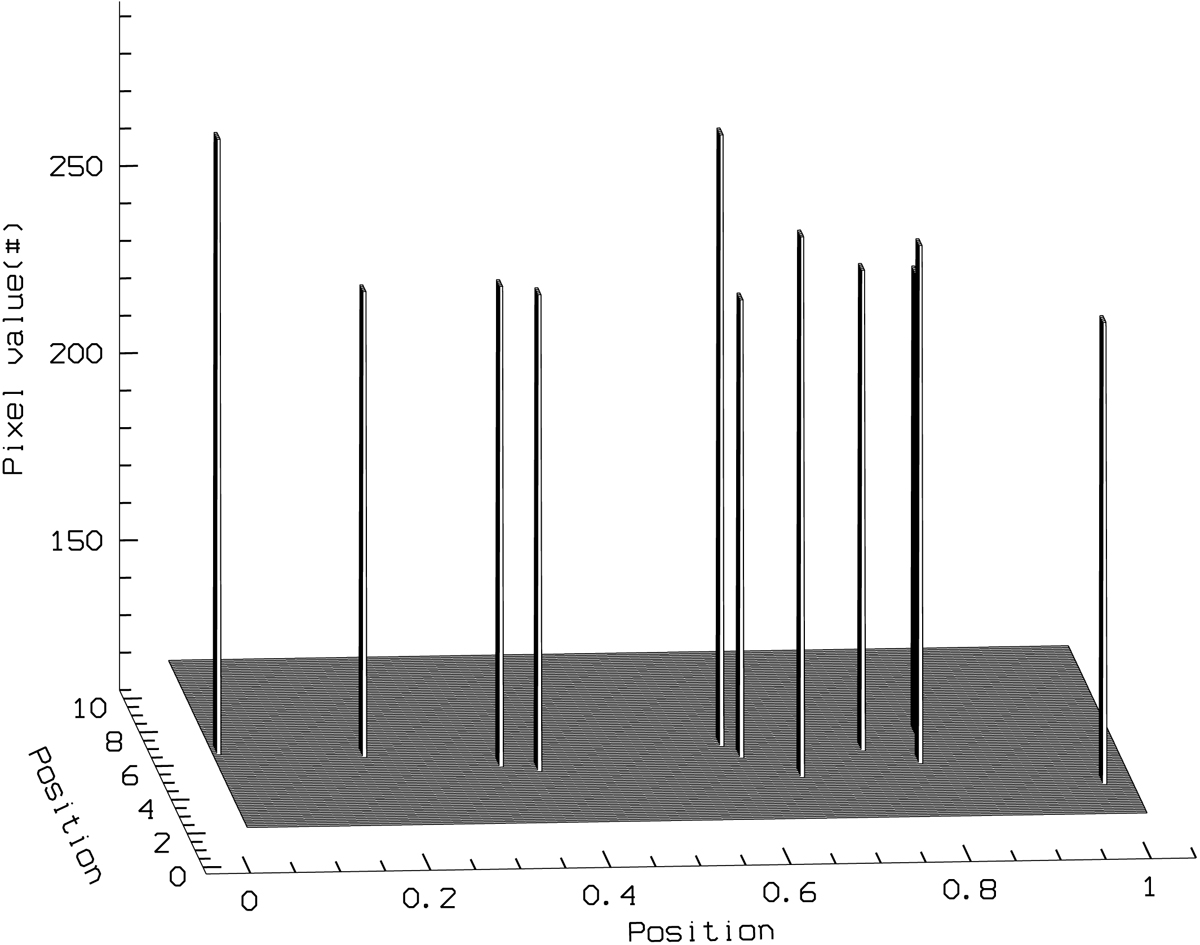
Plane with coordinates of frequency (in c/d, abscissa) and radial-velocity amplitude (in km s−1, ordinate). The data axis provides the number of frequency–amplitude data pairs resulting from circular orbits fitted to the radial velocities in Table 4, as described in Sect. 3.1. Each spike has a footprint of dimensions 0.008 c/d and 0.1 km s−1; only for better visibility were they enlarged. The floor level is ≤30 ± 6 data points per pixel.
Current usage metrics show cumulative count of Article Views (full-text article views including HTML views, PDF and ePub downloads, according to the available data) and Abstracts Views on Vision4Press platform.
Data correspond to usage on the plateform after 2015. The current usage metrics is available 48-96 hours after online publication and is updated daily on week days.
Initial download of the metrics may take a while.