Free Access
Fig. 2.
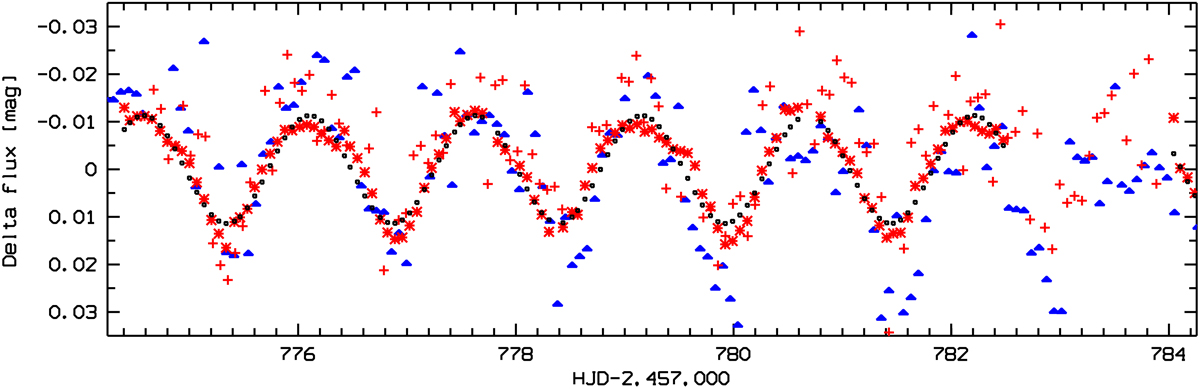
A 10-d stretch (in 2017) of observations of ν Pup with BRITE satellites BLb (blue filled triangles), BHr (red asterisks), and BTr (red crosses). The zeropoints of the magnitude scale are arbitrary. Black dots represent a sine fit to the BHr data. The deviation from sinusoidality is most clearly seen in the BHr data.
Current usage metrics show cumulative count of Article Views (full-text article views including HTML views, PDF and ePub downloads, according to the available data) and Abstracts Views on Vision4Press platform.
Data correspond to usage on the plateform after 2015. The current usage metrics is available 48-96 hours after online publication and is updated daily on week days.
Initial download of the metrics may take a while.