Fig. 10.
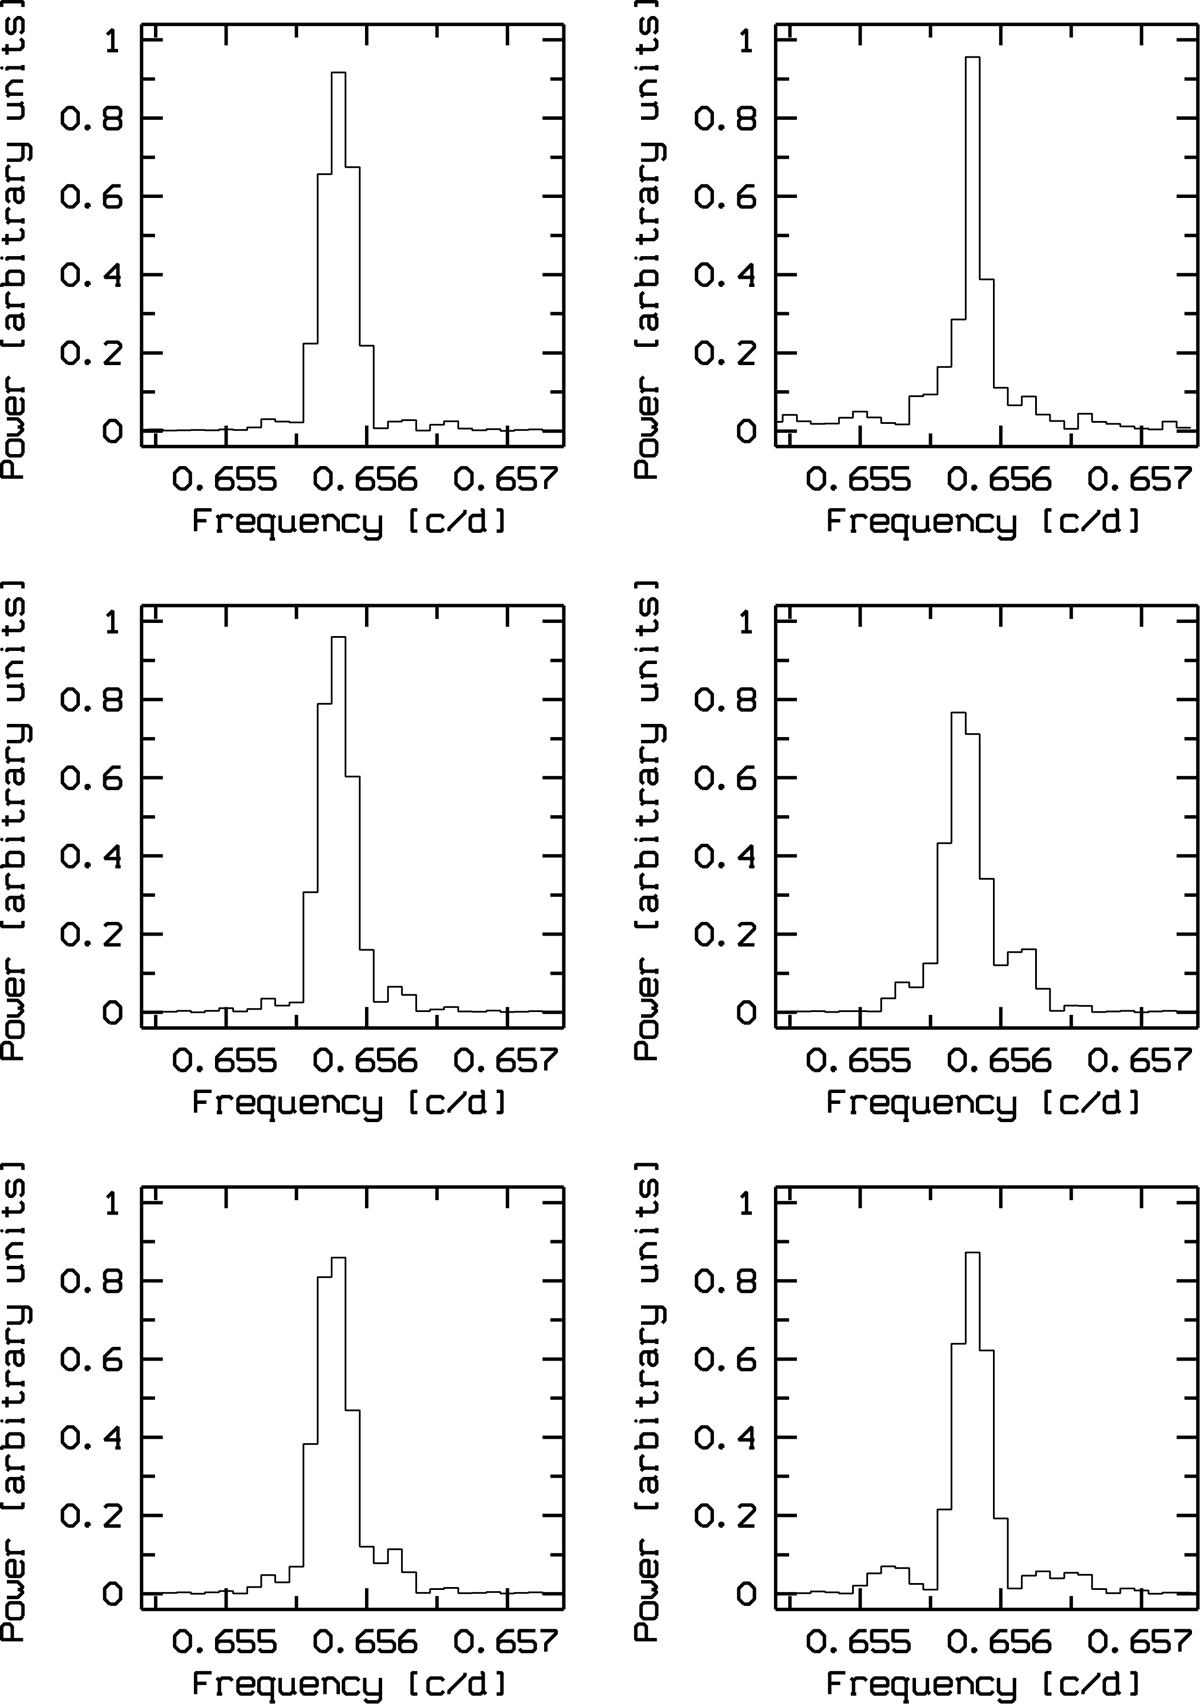
Top left panel: power spectrum of SMEI observations between frequencies f1 and f3 (Table 5). Top right panel: as top left, except for combined SMEI and BRITE data. Other four panels: power spectra of a single sine function with frequency f2 evaluated at SMEI observing times. This variation is modulated with different amplitudes (A) and frequencies (F). 0.0003125 c/d is about the inverse of the time span of the SMEI observations. Middle left panel: A = 10 km s−1, F = 0.0003125 c/d; there is almost no difference w.r.t. the SMEI observations. Middle right panel: A = 30 km s−1, F = 0.0003125 c/d; the strength of the side lobes increases with the amplitude. Bottom left panel: A = 20 km s−1, F = 0.0003125 c/d; bottom right panel: A = 20 km s−1, F = 0.000625 c/d. The separation of main peak and side lobes increases with modulation frequency.
Current usage metrics show cumulative count of Article Views (full-text article views including HTML views, PDF and ePub downloads, according to the available data) and Abstracts Views on Vision4Press platform.
Data correspond to usage on the plateform after 2015. The current usage metrics is available 48-96 hours after online publication and is updated daily on week days.
Initial download of the metrics may take a while.