Fig. 1.
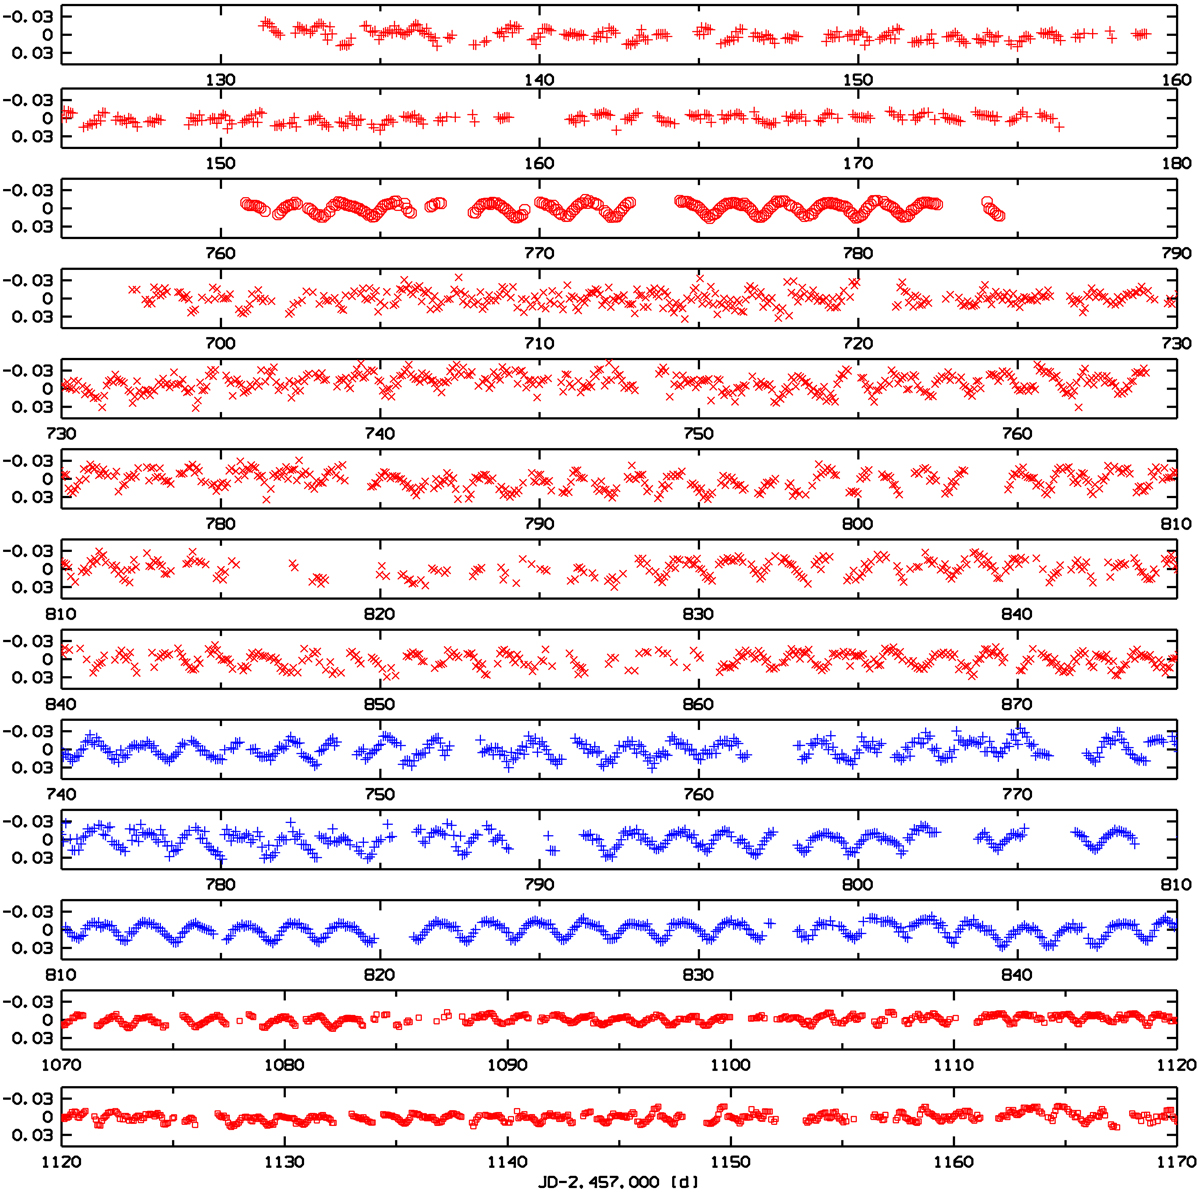
All main strings of BRITE observations of ν Pup in 2015, 2017, and 2018. Very long segments are split with partial duplications. The ordinate is in units of instrumental magnitudes with arbitrary zero point. Symbols: red +: BHr2015; red °: BHr2017; red ×: BTr2017; blue +: BLb2017; red □: BHr2018. Intercomparison of observations in identical time intervals but from different satellites shows that the most regular segments of the light curves are representative and the others deviate as a result of noise. The amplitude was largest in 2017 and lowest in 2018. In the bottom panel, between days 1145 and 1150 and shortly before day 1160, there may have been some mini outbursts.
Current usage metrics show cumulative count of Article Views (full-text article views including HTML views, PDF and ePub downloads, according to the available data) and Abstracts Views on Vision4Press platform.
Data correspond to usage on the plateform after 2015. The current usage metrics is available 48-96 hours after online publication and is updated daily on week days.
Initial download of the metrics may take a while.