Free Access
Fig. 3.
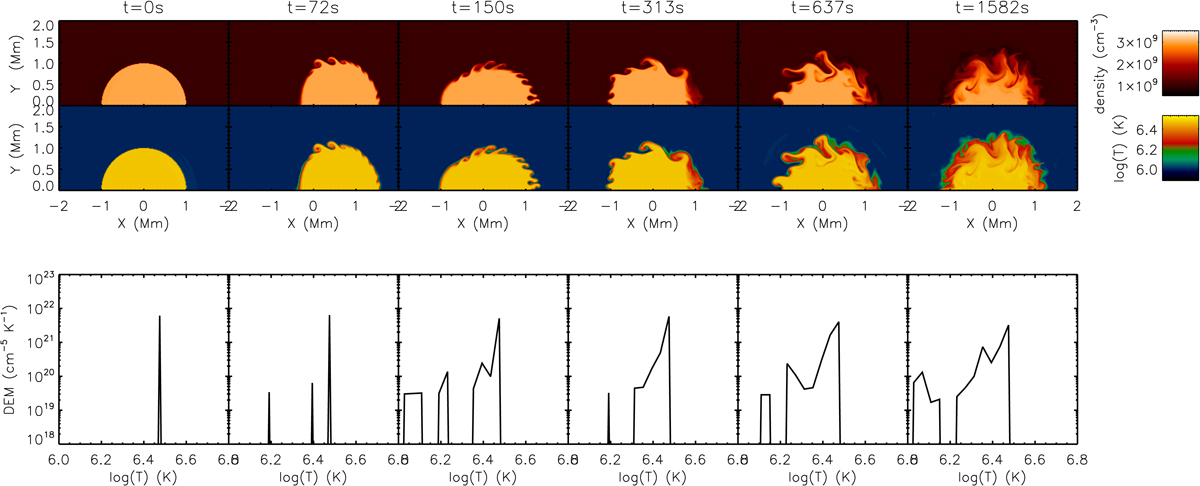
Evolution of density (top row), temperature (middle row) and DEM (bottom row) in the loop top cross section of the impulsively excited model, at the times specified in the title of each column. The DEM was computed for a single pixel corresponding to the LOS through the centre-of-mass, perpendicular to the initial motion.
Current usage metrics show cumulative count of Article Views (full-text article views including HTML views, PDF and ePub downloads, according to the available data) and Abstracts Views on Vision4Press platform.
Data correspond to usage on the plateform after 2015. The current usage metrics is available 48-96 hours after online publication and is updated daily on week days.
Initial download of the metrics may take a while.