Free Access
Fig. 2.
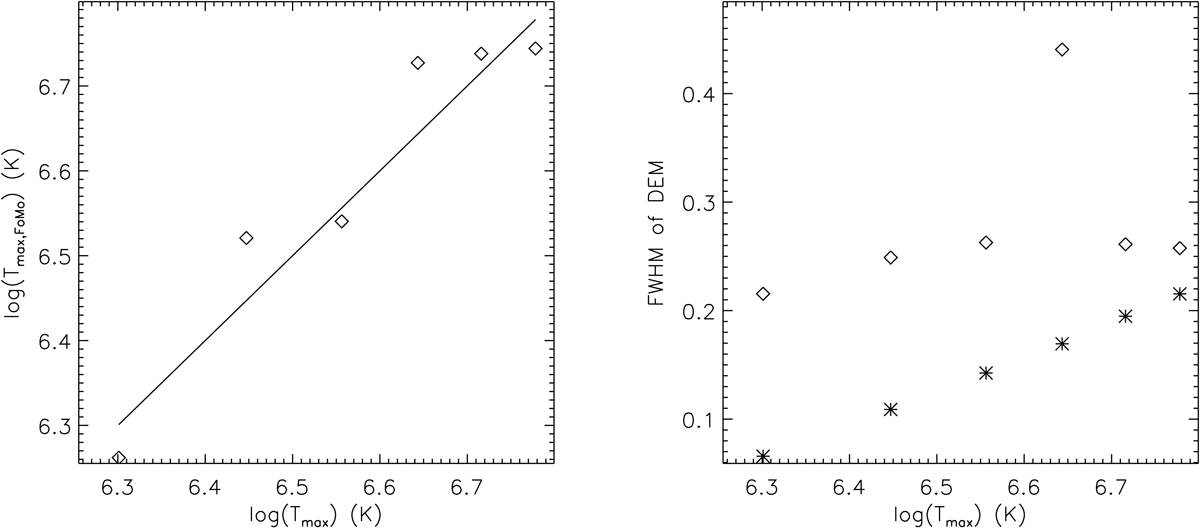
Left panel: peak temperature of the DEM from the forward model compared to the input Tmax. Right panel: FWHM of the DEM as a function of the peak temperature of the profile (Tmax = T(r = 0)), for the numerical DEM without forward modelling (*, middle panel of Fig. 1) and the forward modelled DEM (⋄, bottom panel of Fig. 1).
Current usage metrics show cumulative count of Article Views (full-text article views including HTML views, PDF and ePub downloads, according to the available data) and Abstracts Views on Vision4Press platform.
Data correspond to usage on the plateform after 2015. The current usage metrics is available 48-96 hours after online publication and is updated daily on week days.
Initial download of the metrics may take a while.