Fig. 1.
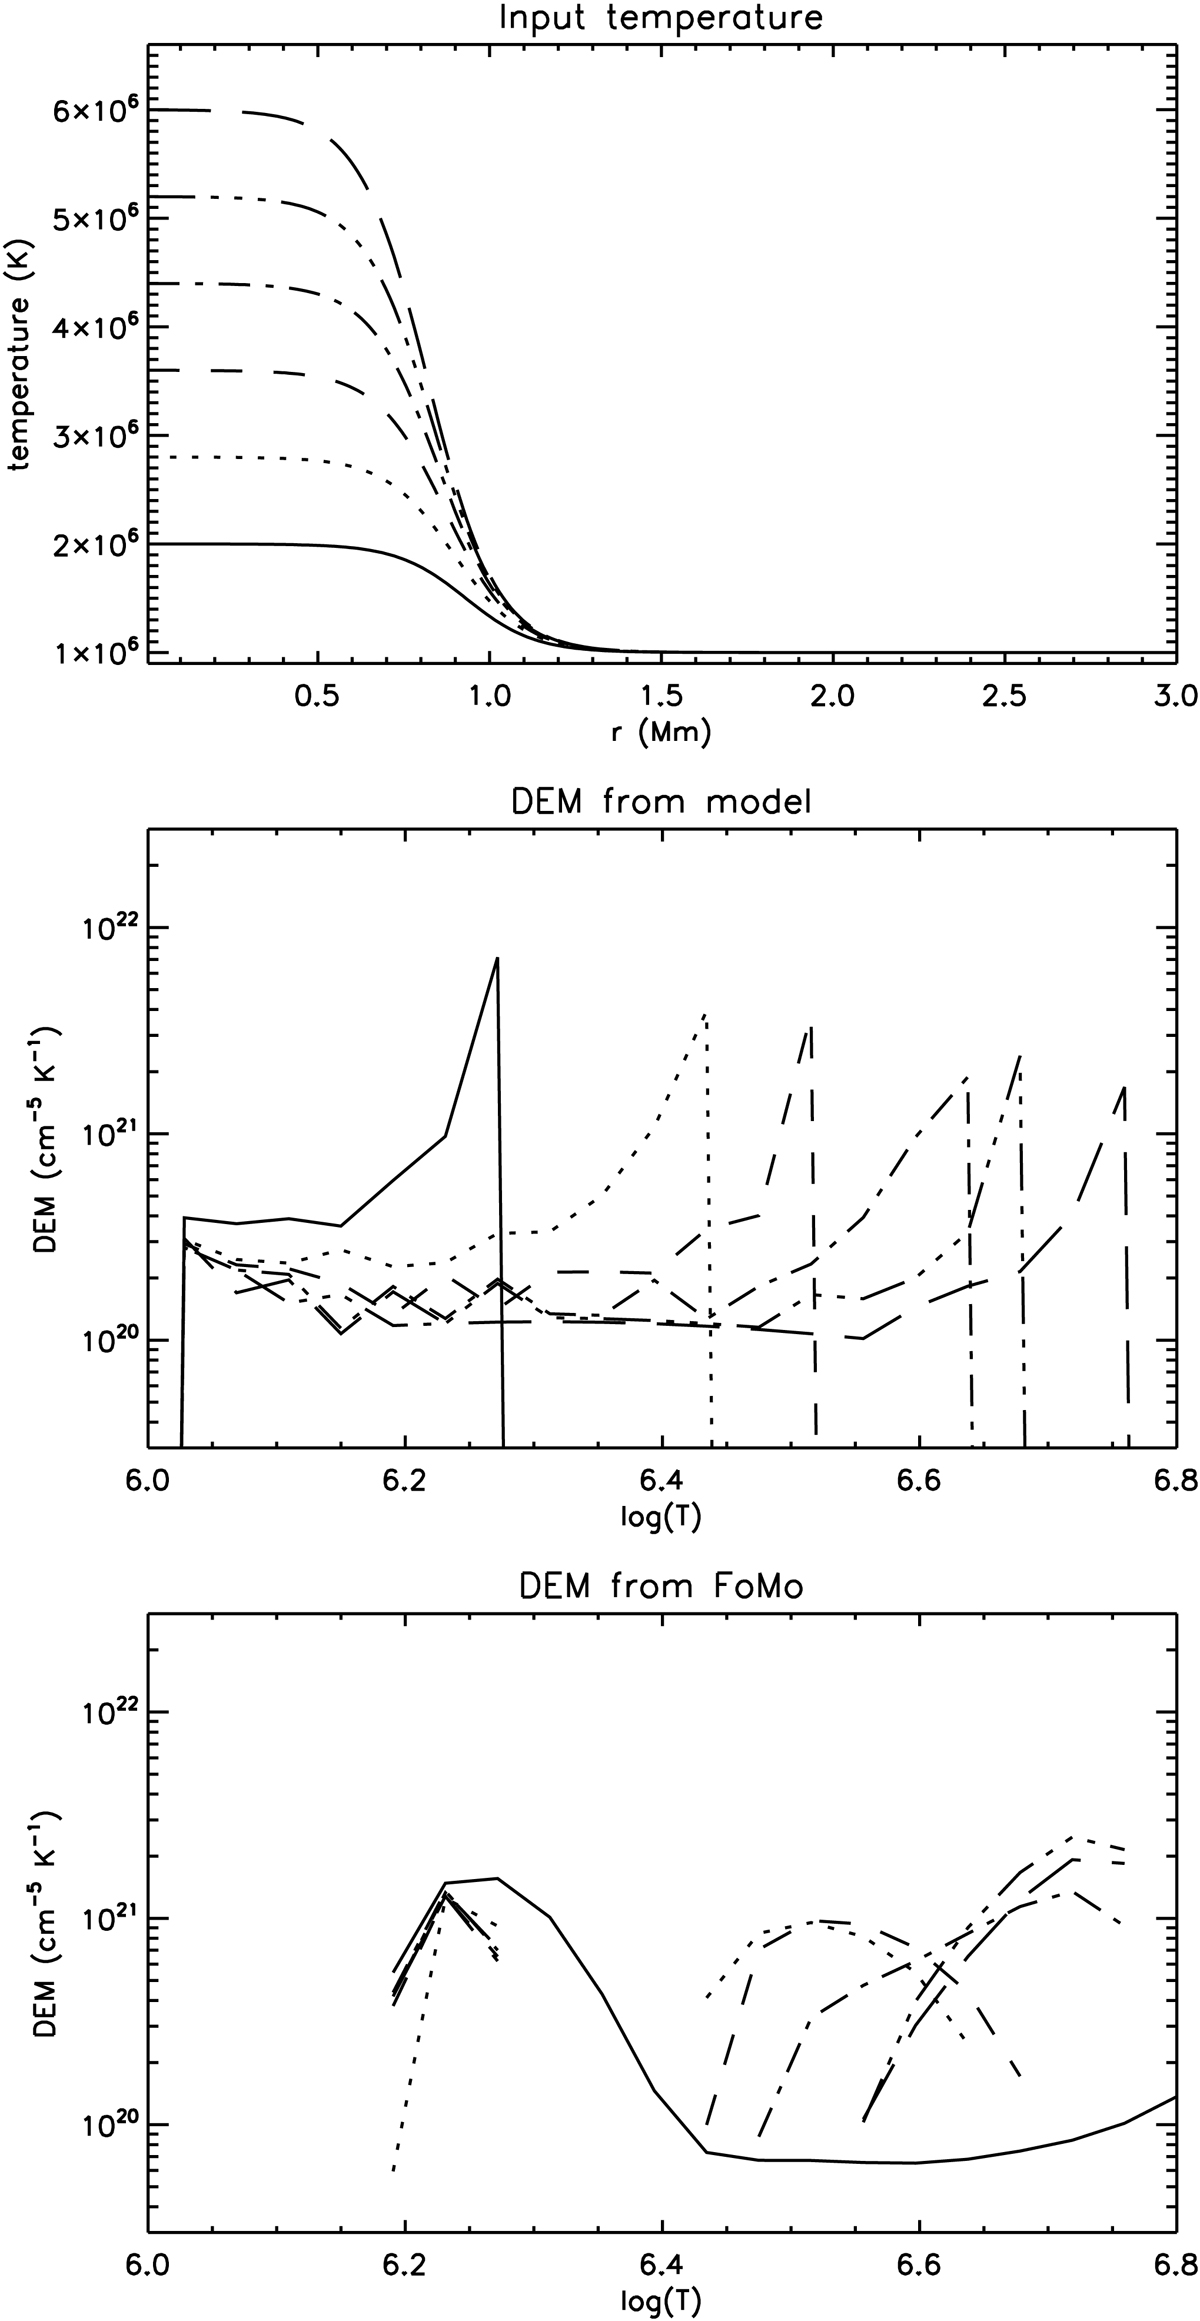
Top panel: different temperature distributions as a function of radius. The linestyle in all panels corresponds to the temperature profile given with that linestyle in the top panel. Middle panel: numerical DEM without forward modelling for the LOS through the centre of the loop. Bottom panel: DEM after forward modelling and DEM inversion.
Current usage metrics show cumulative count of Article Views (full-text article views including HTML views, PDF and ePub downloads, according to the available data) and Abstracts Views on Vision4Press platform.
Data correspond to usage on the plateform after 2015. The current usage metrics is available 48-96 hours after online publication and is updated daily on week days.
Initial download of the metrics may take a while.