Fig. 4.
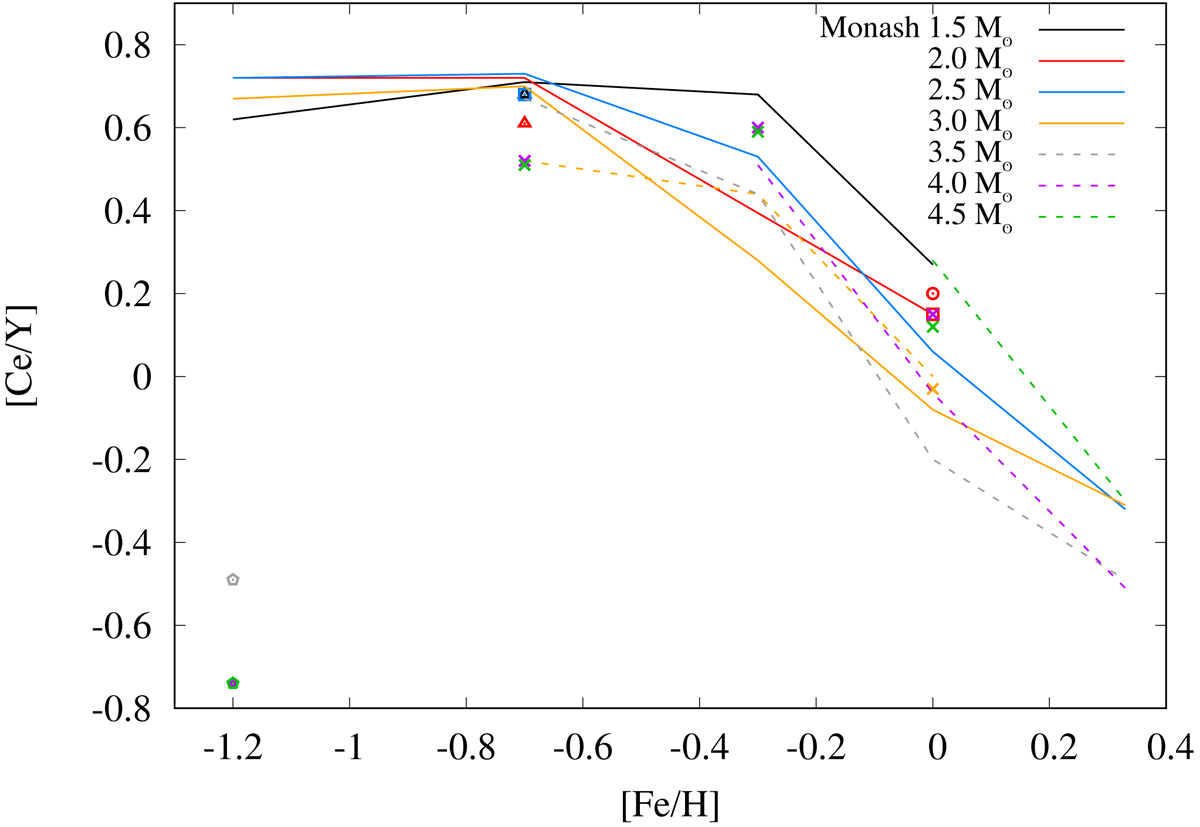
[Ce/Y] ratio vs. [Fe/H] at the stellar surface at the end of the evolution from all the Monash models with [s/Fe] > 0.25 reported in Table 2. As in Fig. 3, the different colours represent different stellar masses. The solid lines represent the models with Mmix = 2 × 10⁻³ M⊙, the dashed lines with Mmix = 1 × 10⁻³ M⊙, and the different types of dots represent the following Mmix values: circle = 1 × 10⁻³ M⊙; square = 4 × 10⁻³ M⊙; triangle = 6 × 10⁻³ M⊙; cross = 1 × 10⁻⁴ M⊙; and diamond = 0.
Current usage metrics show cumulative count of Article Views (full-text article views including HTML views, PDF and ePub downloads, according to the available data) and Abstracts Views on Vision4Press platform.
Data correspond to usage on the plateform after 2015. The current usage metrics is available 48-96 hours after online publication and is updated daily on week days.
Initial download of the metrics may take a while.