Fig. 5
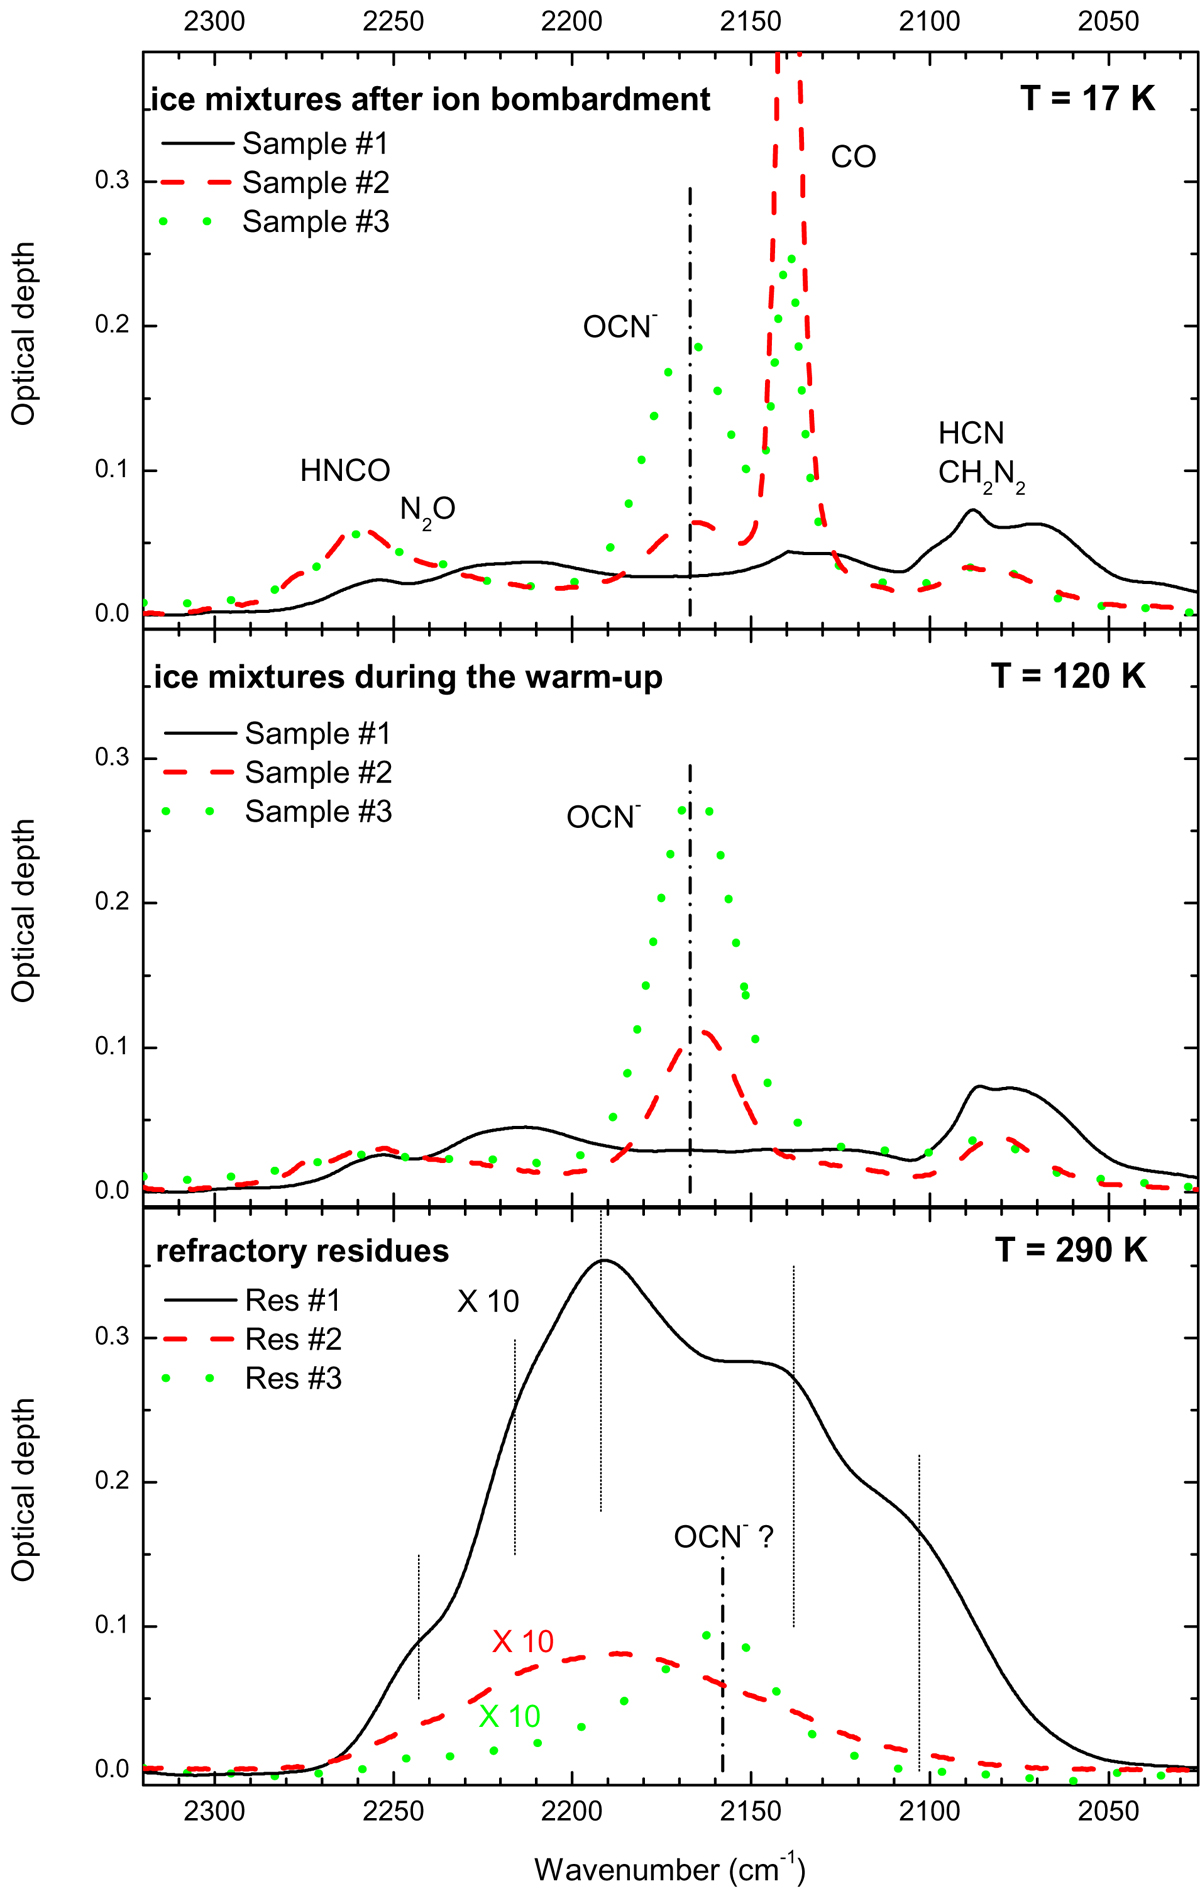
Spectra in the 2320–2025 cm−1 region, evolving with the temperature for three icy mixtures after ion exposure. Sample #1 (N2:CH4 + 200 keV H+), Sample #2 (N2:CH4:CO + 200 keV H+), and Sample #3 (N2:CH4:H2O + 200 keV H+). Top panel: IR spectra of the three samples at 17 K, just after ion irradiation. Central panel shows the IR spectra of the three samples at 120 K, during warm-up. Bottom panel: IR spectra of the three corresponding refractory organic residues at room temperature, magnified 10 times for the sake of clarity.
Current usage metrics show cumulative count of Article Views (full-text article views including HTML views, PDF and ePub downloads, according to the available data) and Abstracts Views on Vision4Press platform.
Data correspond to usage on the plateform after 2015. The current usage metrics is available 48-96 hours after online publication and is updated daily on week days.
Initial download of the metrics may take a while.