Free Access
Fig. 16.
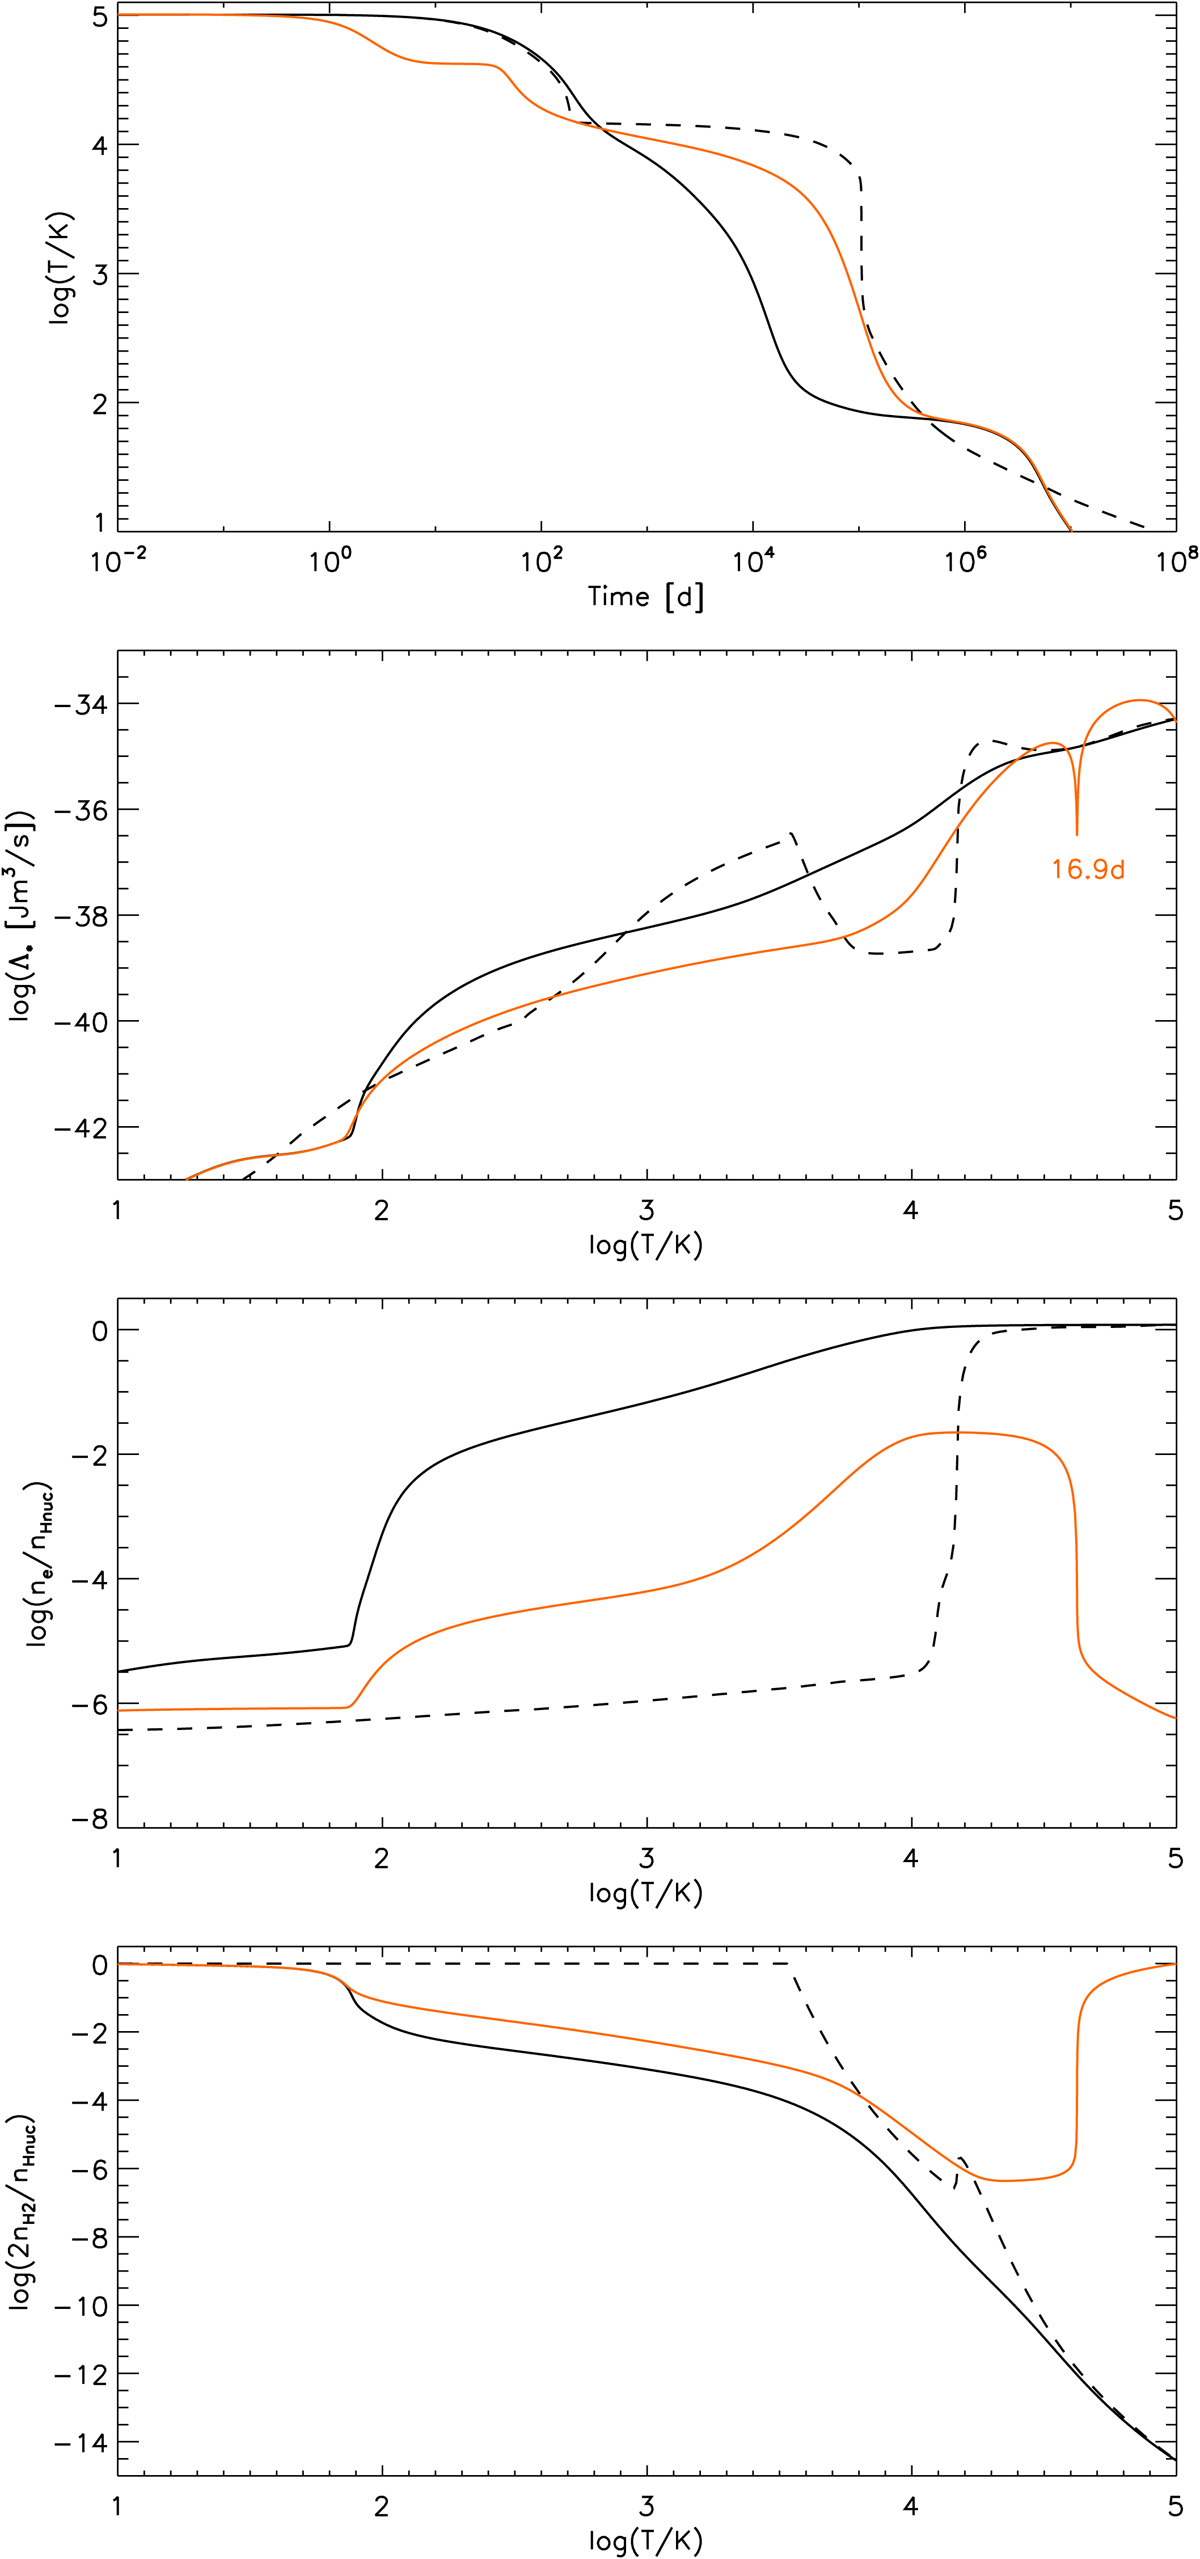
Time dependence of the temperature (top panel) and the net cooling rate (panel 2), electron fraction (panel 3), and molecular hydrogen fraction (bottom panel) as a function of temperature for case A (black solid lines), case B (red lines), and for the equilibrium solution (dashed lines).
Current usage metrics show cumulative count of Article Views (full-text article views including HTML views, PDF and ePub downloads, according to the available data) and Abstracts Views on Vision4Press platform.
Data correspond to usage on the plateform after 2015. The current usage metrics is available 48-96 hours after online publication and is updated daily on week days.
Initial download of the metrics may take a while.