Fig. 3.
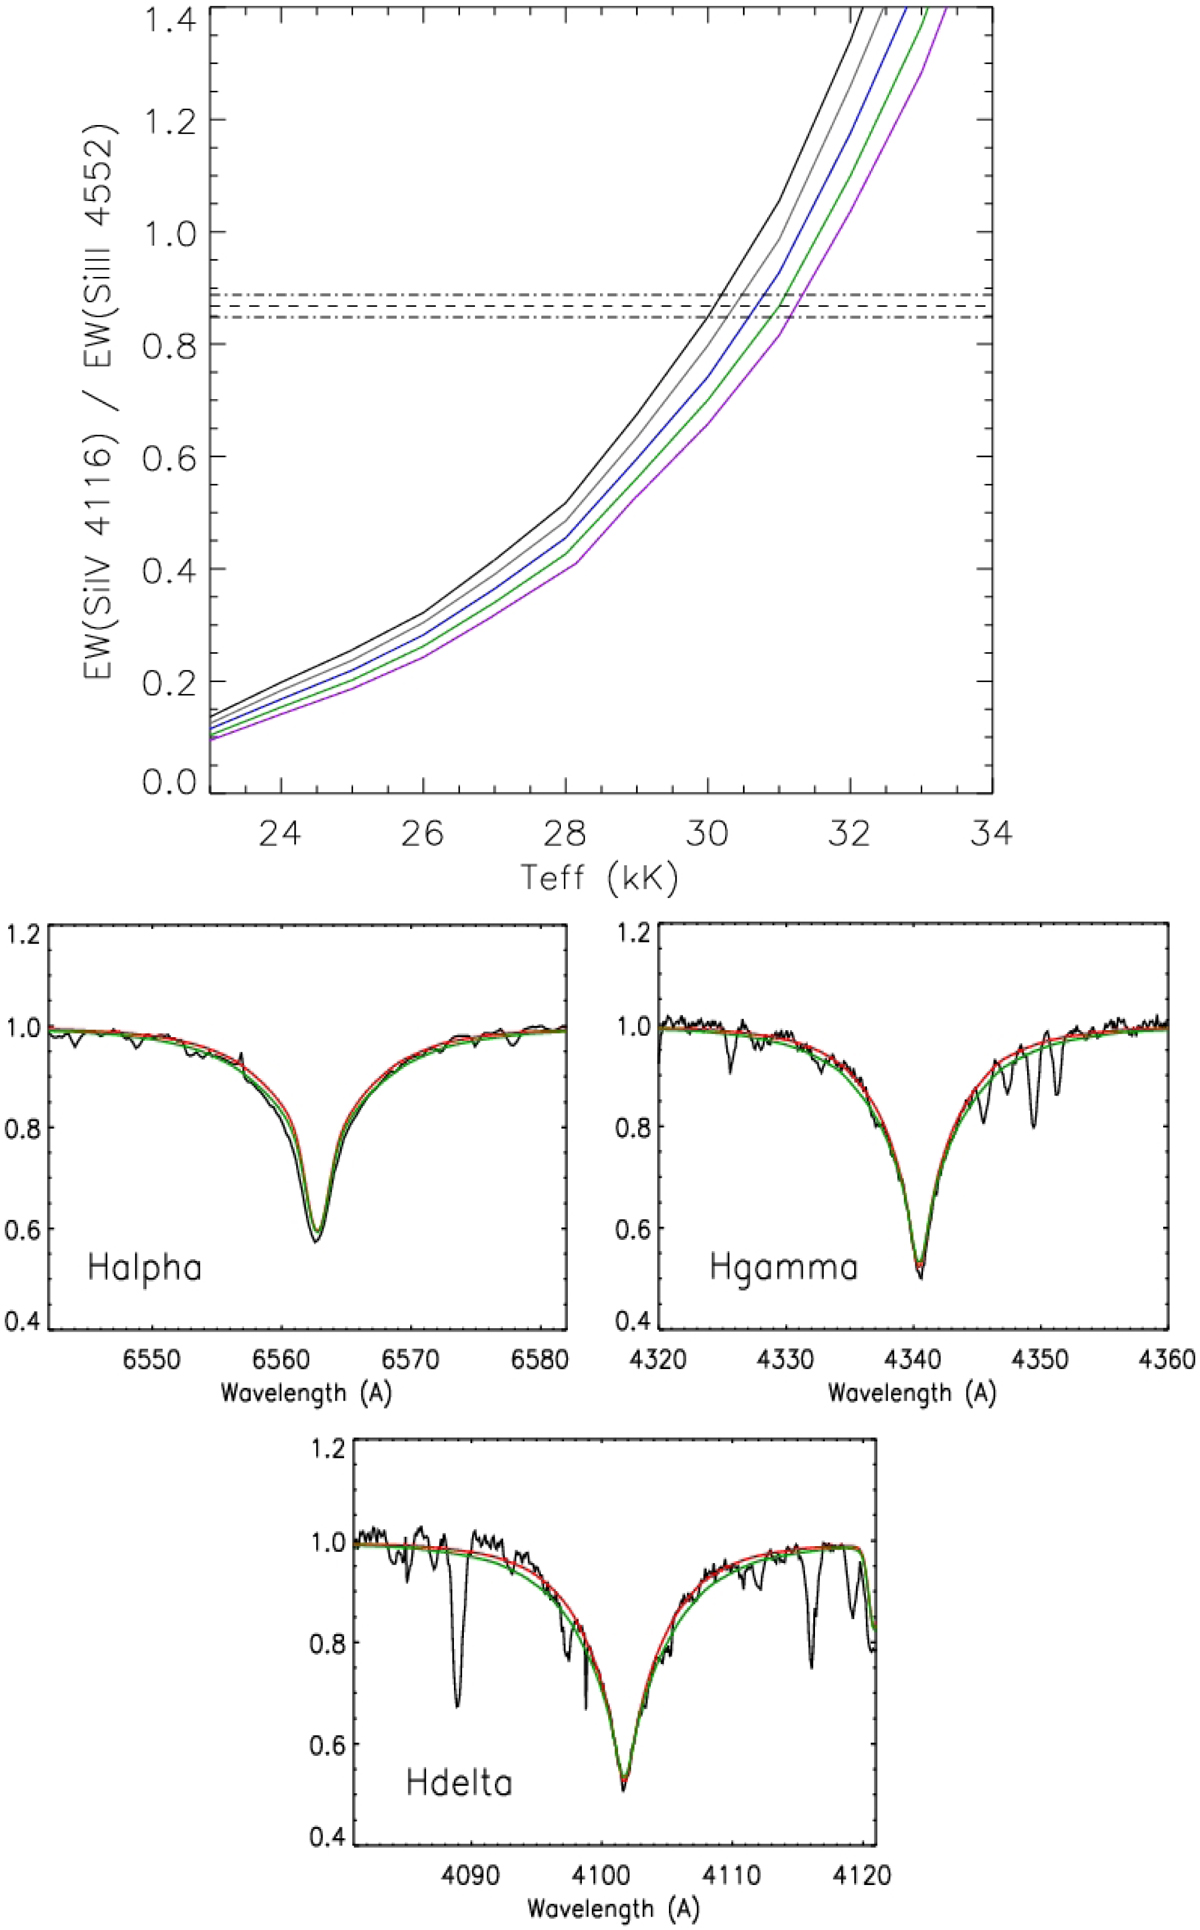
Top: Example of the EW ratio of Si III-IV used as Teff indicator with FASTWIND models for the star J20272428+4115458. Black, gray, blue, green and purple lines correspond to log g values of 3.9, 4.0, 4.1, 4.2 and 4.3 dex respectively. The horizontal dashed line indicates the EW ratio of the star and its associated uncertainty is indicated by the dash-dotted lines. Bottom: Example of the H Balmer lines fitting to determine log g for the same star. Only two FASTWIND models are compared with the observed spectrum (black line) for clarity. In red, the Teff = 30 000 K, log g = 3.9 dex model. In green, the Teff = 31 000 K, log g = 4.2 dex model. Final fits can be seen in Figs. C.1–C.8.
Current usage metrics show cumulative count of Article Views (full-text article views including HTML views, PDF and ePub downloads, according to the available data) and Abstracts Views on Vision4Press platform.
Data correspond to usage on the plateform after 2015. The current usage metrics is available 48-96 hours after online publication and is updated daily on week days.
Initial download of the metrics may take a while.