Fig. 9.
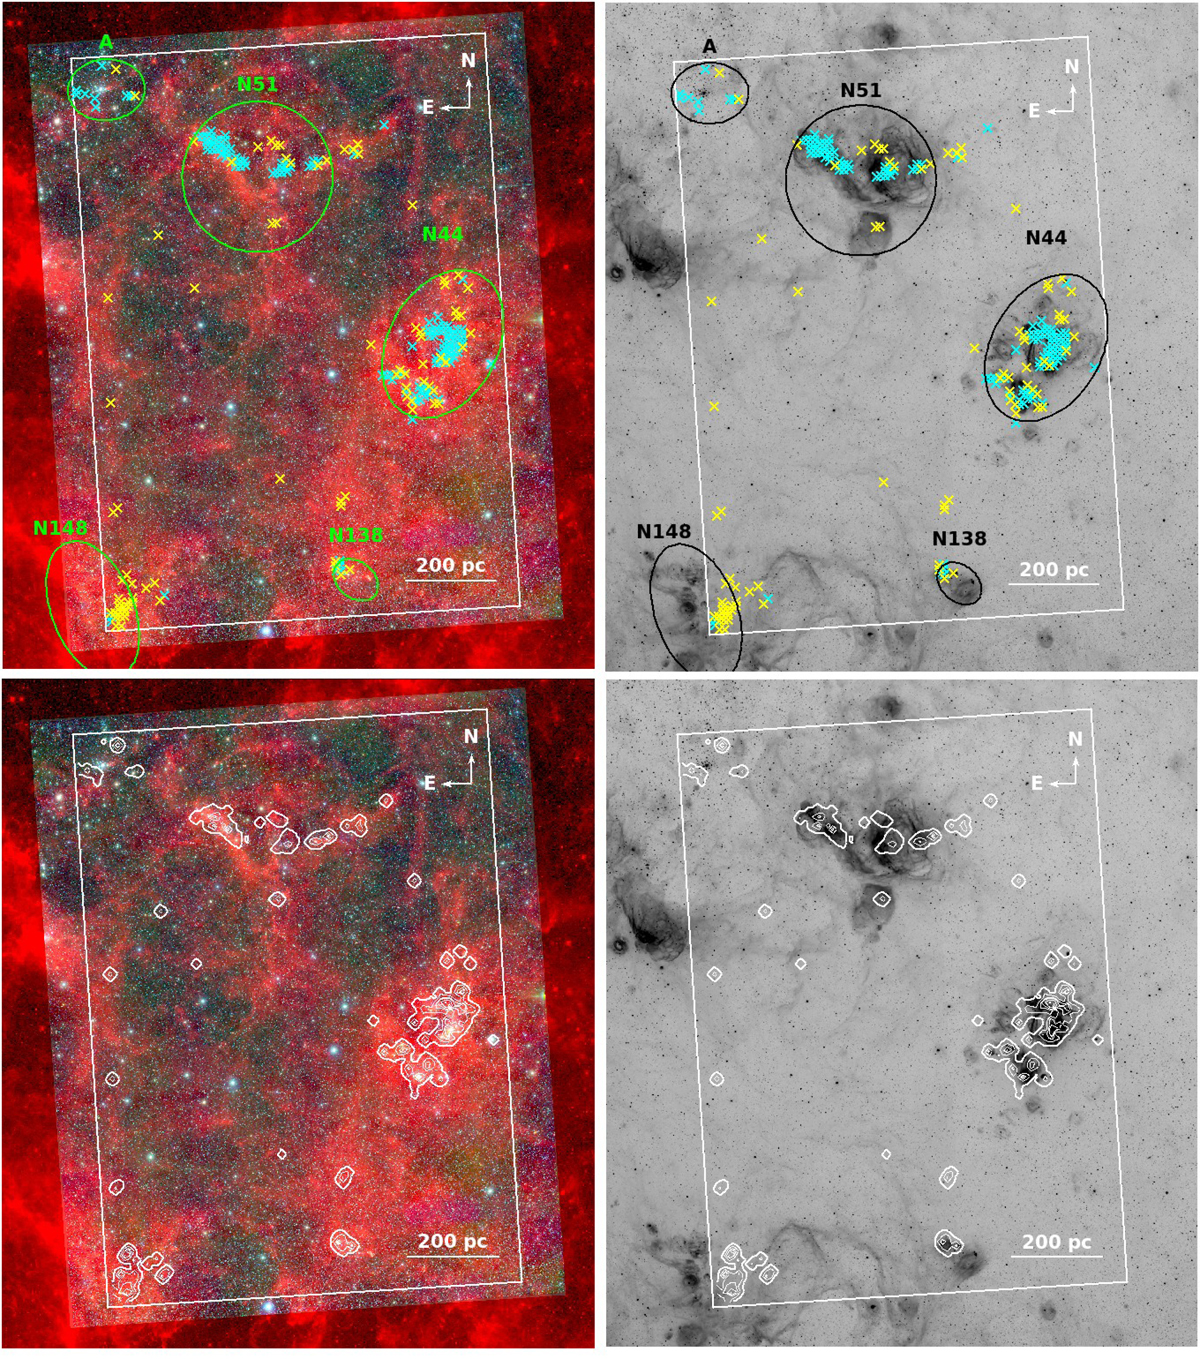
Top left: three-colour composite image with VMC Y (blue) and Ks bands (green), and Spitzer IRAC 8.0 μm (red). The rectangle shows the region covered by our analysis. Small crosses mark the centres of grid elements for the 40″ grid that are classified as PMS-only (yellow) or UMS+PMS (cyan). Several prominent regions are highlighted and labelled (spatial sizes according to Bica et al. 2008) and discussed further in Sect. 6. Top right: inverted grey-scale map of Hα emission (Smith et al. 2005). Bottom: PMS density contours for elements classified as PMS-only or UMS+PMS derived from the residual maps of the grid elements. The outermost contour represents ΔnPMS = 2.4 stars arcmin−2 (see Sect. 6.2 for details); every subsequent contour represents an increase in density by 3 × ΔnPMS.
Current usage metrics show cumulative count of Article Views (full-text article views including HTML views, PDF and ePub downloads, according to the available data) and Abstracts Views on Vision4Press platform.
Data correspond to usage on the plateform after 2015. The current usage metrics is available 48-96 hours after online publication and is updated daily on week days.
Initial download of the metrics may take a while.