Fig. 7.
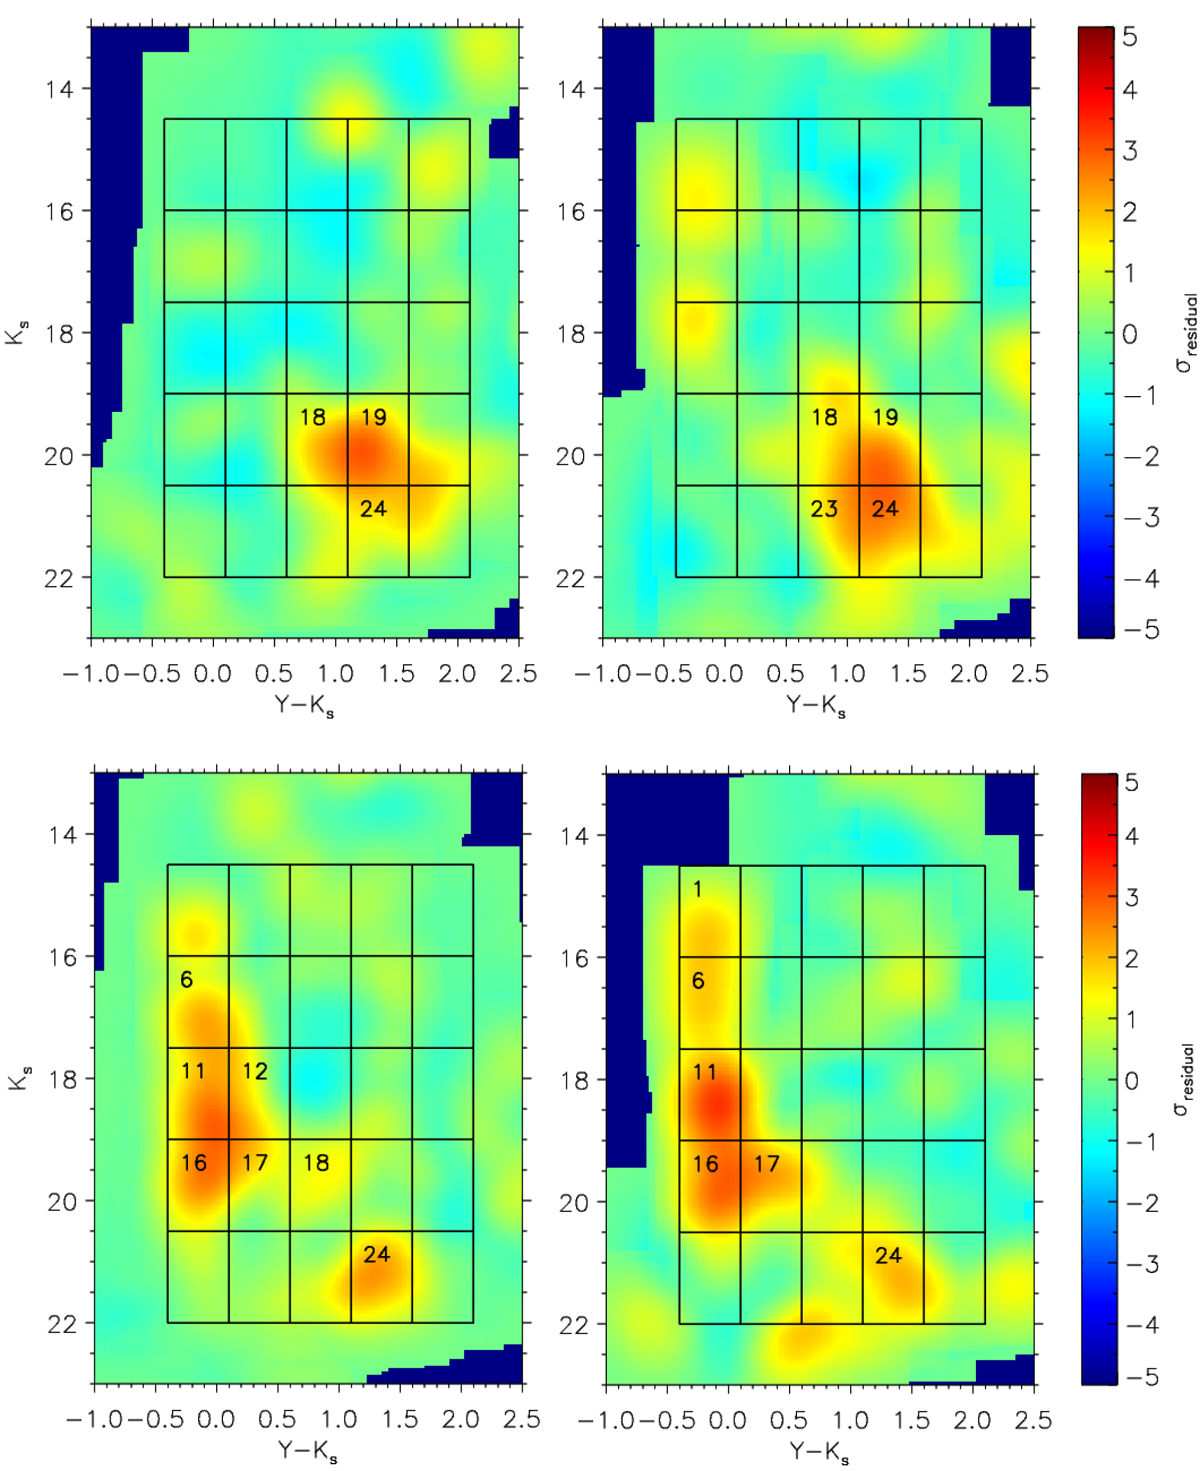
Top: significance map for a PMS-only classified grid element (left) is compared to a synthetic stellar population of 250 M⊙ and 1 Myr (right). Bottom: similar to the top, but showing a UMS+PMS classified grid element (left) and a synthetic stellar population of 1000 M⊙ and 5 Myr (right). Flagged boxes are numbered in each map.
Current usage metrics show cumulative count of Article Views (full-text article views including HTML views, PDF and ePub downloads, according to the available data) and Abstracts Views on Vision4Press platform.
Data correspond to usage on the plateform after 2015. The current usage metrics is available 48-96 hours after online publication and is updated daily on week days.
Initial download of the metrics may take a while.