Fig. 6.
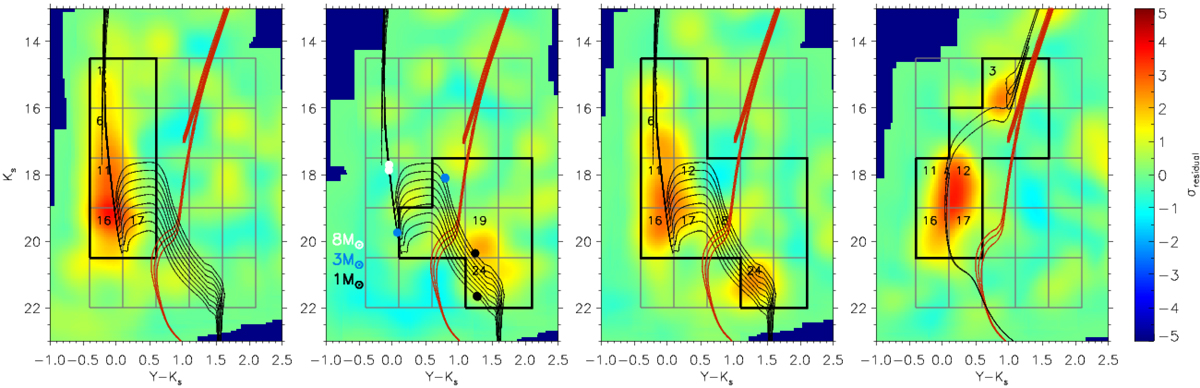
From left to right: significance maps for grid elements classified as UMS-only, PMS-only, UMS+PMS, and “old”. The CMD boxes relevant for each classification are highlighted. Boxes that are flagged in the particular significance map are numbered. PARSEC isochrones (Bressan et al. 2012) are shown in all panels. Red isochrones represent ages from log(t/yr) = 9.6 − 9.8, with a metallicity of Z = 0.0033 (Tatton et al. 2013); they show the typical location of the old LMC field population. Black isochrones represent young populations from log(t/yr) = 6.0 − 6.8 (Z = 0.008; Rubele et al. 2012). The two black isochrones in the rightmost panel represent populations of log(t/yr) = 8.5 − 8.6 (Z = 0.008). All isochrones are reddened according to the mean extinction for that particular grid element (Sect. 3.2). In the second panel the theoretical positions for stars of three different masses are shown (colour-coded circles) for the youngest and oldest black isochrones.
Current usage metrics show cumulative count of Article Views (full-text article views including HTML views, PDF and ePub downloads, according to the available data) and Abstracts Views on Vision4Press platform.
Data correspond to usage on the plateform after 2015. The current usage metrics is available 48-96 hours after online publication and is updated daily on week days.
Initial download of the metrics may take a while.