Fig. 5.
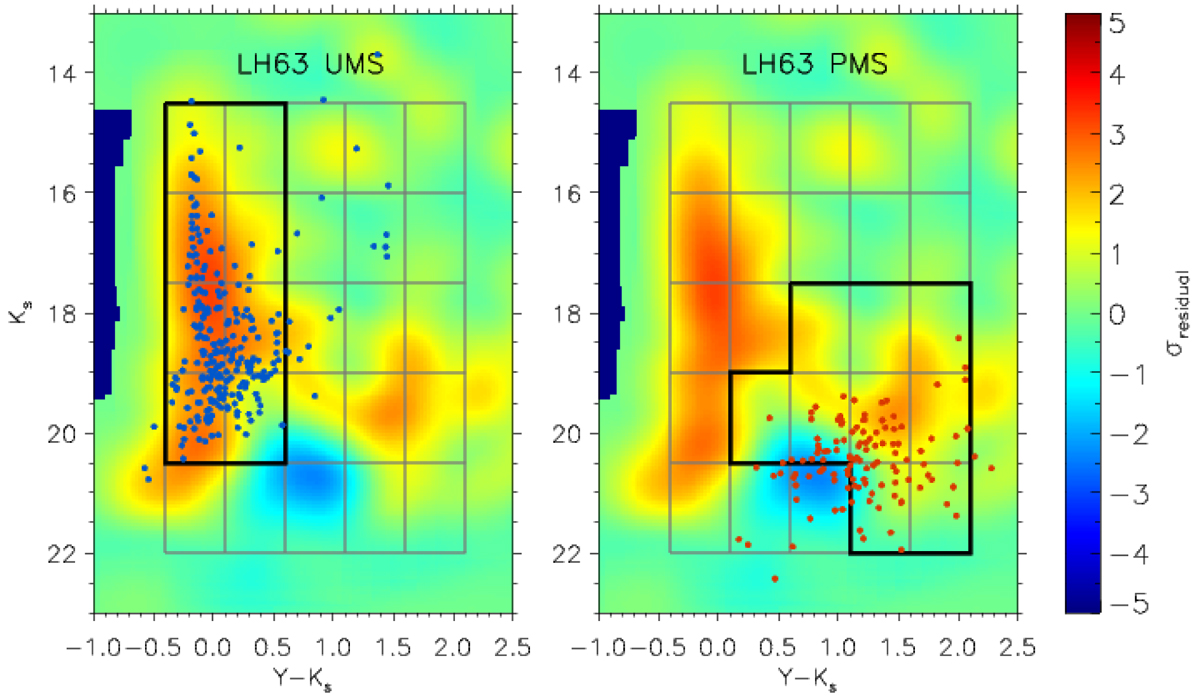
Same significance map in the background as shown in Fig. 4 (bottom). Blue and red symbols display VMC sources that are successfully matched to the LH 63 UMS (left) and PMS (right) catalogues from Gouliermis et al. (2011). Thick black lines highlight the boxes relevant for the UMS and PMS classifications, respectively (see also Fig. 6).
Current usage metrics show cumulative count of Article Views (full-text article views including HTML views, PDF and ePub downloads, according to the available data) and Abstracts Views on Vision4Press platform.
Data correspond to usage on the plateform after 2015. The current usage metrics is available 48-96 hours after online publication and is updated daily on week days.
Initial download of the metrics may take a while.