Fig. 4.
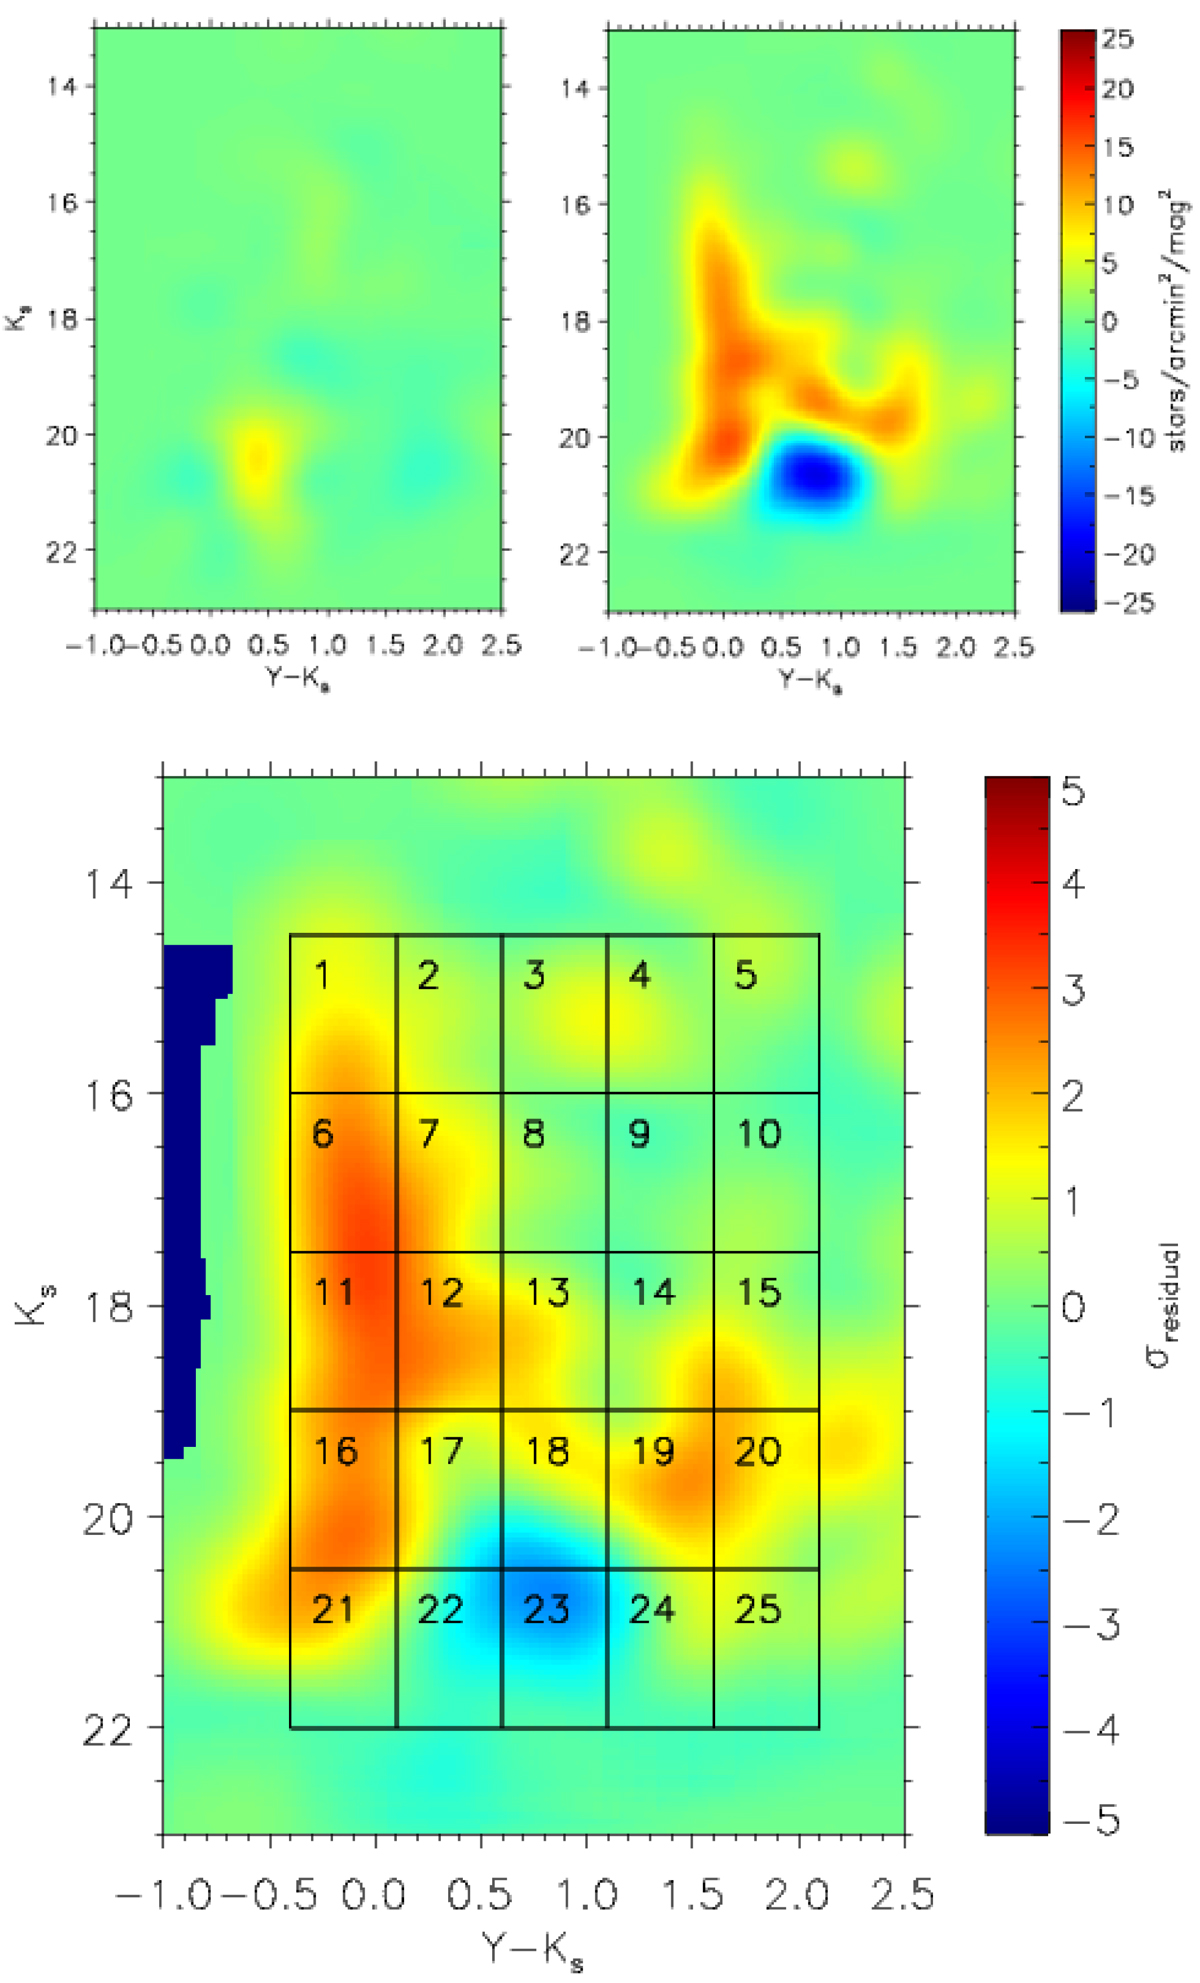
Top left: residual map generated for a grid element showing no significant density excesses, leading to a featureless residual map; such a grid element is thus dominated by the old LMC field population. Top right: residual map for a grid element that includes the OB association LH 63. Significant density excesses can be seen across the CMD, which is due to the presence of massive OB and PMS stars. Bottom: significance map for the same LH 63 region with 25 CMD boxes overlaid; these are used to classify candidate regions based on observed density excesses (see Sect. 4).
Current usage metrics show cumulative count of Article Views (full-text article views including HTML views, PDF and ePub downloads, according to the available data) and Abstracts Views on Vision4Press platform.
Data correspond to usage on the plateform after 2015. The current usage metrics is available 48-96 hours after online publication and is updated daily on week days.
Initial download of the metrics may take a while.